Similar S&P 500 Ranges Have Always Resulted In New Highs, But…

Yesterday, we looked at the unusual uptick in stock market volatility despite its recent range-bound behavior. Today, we look at the S&P 500′s recent range in a different light. What has been so unusual about the tight range is that A) it has not been expanded up or down in over a month and B) it has remained very close to the index’s 52-week high. More specifically, the S&P 500 has not made even a new 1-month high or a 1-month low over the past month. At the same time, it has not ventured more than 3% from its 52-week high at any point during the month. This is a historically rare feat as there have been just 9 other similar periods in the S&P 500 since 1950.
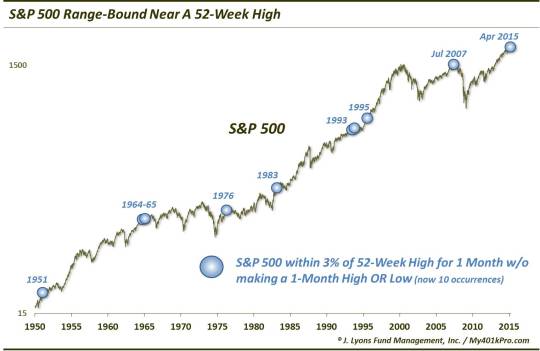
Some of the similar ranges of the past included several days that met the above criteria. There were just 9 unique occurrences, however, culminating in the following months:
- March 1951
- November 1964
- March 1965
- May 1976
- April 1983
- August 1993
- December 1993
- August 1995
- July 2007
Looking at these similar tight ranges near 52-week highs historically, we find some good news and some not-so-good news. First, the good news. All 9 of the prior ranges saw the S&P 500 eventually go on to make new highs, though some initially broke the range to the downside first. 2 months later, 8 of the 9 instances saw the S&P 500 not only higher but at a new 52-week high. Only the 2007 instance saw the index lower 2 months later, although it was at a new high 3 months afterward (and it had made a new high immediately following the range break).
Now the not-so-good news. On 5 of the 9 occasions, the new highs were very small and very short-lived. Following occurrences in 1965, 1976, 1983, December 1993 and 2007, the market’s upside “breakout” resulted in tops shortly afterward that would predominantly hold for the following year. Only the occurrences in 1951, 1964 and 1995 saw the market persist at new highs for an extended period of time. Furthermore, only 1995 saw the S&P 500 continue on to double digit returns over the following year.
Here is a table of the results following the 9 prior ranges near highs in the S&P 500 similar to what we are seeing now:
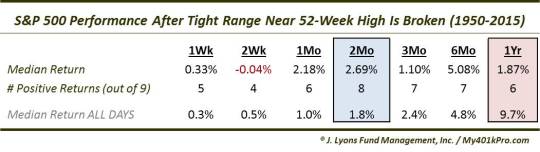
Again, the sweet spot has been 2 months later with 8 of the 9 precedents showing gains. The less-sweet spot is 1 year out as the median gain is very small with 3 of the 9 occurrences showing losses and 3 others showing gains of less than 3%.
So the good news, based on historical precedent, is that we are likely to see a new 52-week high in the S&P 500 sooner or later. Who knows, with today’s positive action, it may be sooner. The fly in the ointment is that several of the similar historical ranges saw their breakouts fail, and in significant fashion. This will be something to monitor in the future as even upside resolution to this tight range should not enable us to take our guard down.
________
More from Dana Lyons, JLFMI and My401kPro.
The commentary included in this blog is provided for informational purposes only. It does not constitute a recommendation to invest in any specific investment product or service. Proper due diligence should be performed before investing in any investment vehicle. There is a risk of loss involved in all investments.


