Stocks Near Highs But Retail Trading Subdued

We have covered many of the popular and not-so-popular stock market sentiment indicators over the past several months. With the exception of some very short-term examples, the message has almost been unanimous among them: bullishness is historically extreme. And while not a perfect timing tool, extremes in sentiment invariably result in the market eventually moving substantially in the direction opposite the sentiment. One indicator, however, that has been showing recent restraint on the part of investors is the TD Ameritrade Investor Movement Index, or IMX.
What is the IMX? From TDA’s website:
The Investor Movement Index, or the IMX, is a proprietary, behavior-based index created by TD Ameritrade designed to indicate the sentiment of individual investors’ portfolios. It measures what investors are actually doing, and how they are actually positioned in the markets.
The IMX does this by using data including holdings/positions, trading activity, and other data from a sample of our 6 million funded client accounts.
As analysts, we always welcome new inputs and indicators in our endeavor to acquire an edge in the markets. If you have been following our blog or Tweets over the past year, you’ll probably recognize that we like to look at market factors beyond those traditionally covered. As sentiment indicators go, we are especially fond of those that track actual investor positions or activity as opposed to surveys. Therefore, we are immediately attracted to TDA’s IMX series as it fits that criteria. Obviously, one challenge with the indicator is the fact that it is fairly new, having been introduced in 2010. However, that may be enough time now to begin to be able to draw some value from its readings.
Historically, the IMX (which is calculated monthly) has usually moved in the same direction as the market, as represented by the S&P 500. From January 2010 to September 2014, the correlation coefficient between the IMX and the S&P 500 was +.64. However, something changed beginning in October of last year, perhaps due to the nasty intra-month selloff and V-Bottom recovery. Since October, the correlation coefficient between the two series is -.38. Thus, as stocks have generally moved higher on a monthly basis since September, the IMX has consistently moved lower, creating perhaps the widest divergence between the two since the inception of the IMX.
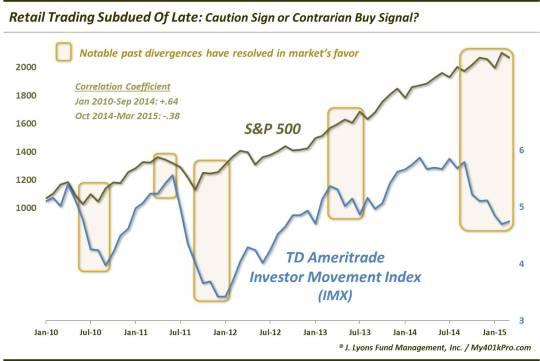
What is going on with TDA’s retail trading community? Over the past 6 months, per the IMX description, they have become less active, less invested or invested in less risky securities – or most likely, some combination of all of those things. The net result, according to the IMX, is that the composite sentiment among retail traders at TDA has dropped markedly given the general rally in stocks over the past 6 months.
So is this relatively depressed sentiment a sign of caution for the stock market…or is it a bullish development on a contrarian basis? Well, our instinct based on many decades of tracking investor sentiment behavior is to fade the sentiment and go with the market. Fortunately, with over 5 years of IMX readings, we at least have some precedent to help us assess the merit of that position.
Since 2010, we detect 4 other noticable examples of the IMX diverging with the S&P 500. In each one, the divergence was eventually resolved in the direction of the S&P 500.
- In mid-2010 after the flash crash, the S&P 500 stabilized and began to move higher as the IMX continued down to new lows. Stocks began a furious rally shortly after.
- In mid-2011, the S&P 500 began to falter while the IMX moved to a new high. Stocks crashed soon after.
- After the crash in late-2011, the S&P 500 gradually recovered into year-end while the IMX continued to move lower to new all-time lows. Stocks rally sharply afterward.
- After the selloff in May-June 2013, the S&P 500 stabilized and chopped higher into the fall while the IMX continued to chop lower. Stocks resumed their sharp rally thereafter.
So you can see that while we’d like to give the traders the benefit of the doubt, history has taught us that it would be costly to do so.
We are constantly on the hunt for new market inputs and indicators to help give us an edge. The Investor Movement Index produced by TD Ameritrade is a welcomed new sentiment indicator, particularly as it is a measure of actual investor behavior. And based on the IMX’s limited historical record, the subdued activity on the part of retail traders, despite a stock market near its all-time highs, may be a bullish signal for stocks in the short to intermediate-term.
________
“Meh” photo by Rick Harris.
More from Dana Lyons, JLFMI and My401kPro.
The commentary included in this blog is provided for informational purposes only. It does not constitute a recommendation to invest in any specific investment product or service. Proper due diligence should be performed before investing in any investment vehicle. There is a risk of loss involved in all investments.


