U.S. Stocks Still Spinning Their Wheels

We have spent quite a bit of ink in this blog recently covering various aspects, and potential implications of the ongoing range in the U.S. stock market. As students of the market, we attempt to observe, identify and (hopefully) accurately interpret what is happening in the markets. And currently what is happening in the stock market is a whole lot of nothing. Actually, that isn’t totally accurate. In actuality, there is plenty of action going on, just not a lot of ground being covered. In other words, the stock market is spinning its wheels right now – and at a pretty good clip as it turns out.
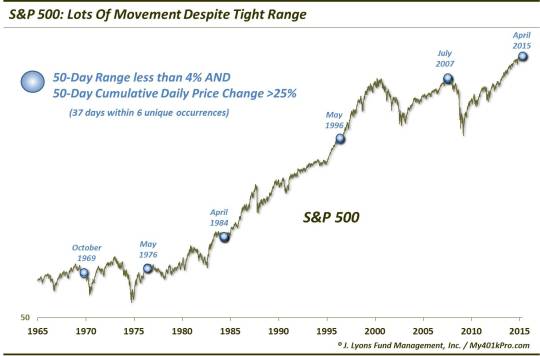
Over the past 50 days, the S&P 500 has traded within a historically tight range. The distance from its closing high to closing low during that time is a mere 3.78%. Of the 16,000+ rolling 50-day ranges since 1950, that ranks as the 423rd tightest, or between the 2nd and 3rd percentile. The average 50-day range is closer to 10%. And since establishing the high and low of the range early on, the S&P 500 has failed to set either a 1-month high or low in the last 27 days.
However, despite the fact that the S&P 500 has failed to cover any ground during its 50-day range – up or down – it has actually covered quite a bit of ground within the range when considering the daily price changes on the index. The cumulative price change (i.e., the sum of the absolute value of each day’s move) in the S&P 500 over those 50 days is more than 26%. In other words, the S&P 500 has moved by an average of more than one half of 1% on each day during the 50-day range.
To put that into perspective, there have been a total of 559 50-day ranges of less than 4% since 1950. The median cumulative price change for those tight ranges has been 16.5%. So this 50-day range has seen over 50% more daily price movement than is typical within such ranges. And of all the 559 sub-4% 50-day ranges, the 26% cumulative daily price change ranks as the 29th biggest. In fact, since 1950, there have been only 37 days that have seen such a tight range over 50 days with so much daily movement within that range.
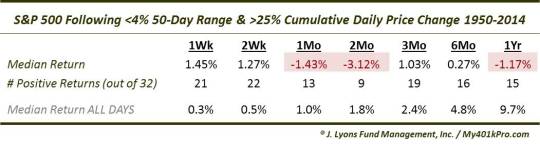
So how do we interpret this? Some of the angles through which we’ve looked at the recent range have suggested a possible outcome of above-average short-term performance followed by longer-term returns that were well below-average (those suggestions are based on historical precedents following similar ranges; of course, past performance may not be indicative of future results). The aftermath of historical precedents in today’s study show a similar story. That is, following 50-day ranges of <4% with cumulative daily price changes >25% have in general been followed by decent results in the weeks following but significantly weak results from 1-12 months afterward. Here are the results following the 32 occurrences prior to our present case.
Like other studies into similar ranges, the 37 total occurrences have come in a few distinct clusters, as is evident on the chart. In attempting to gain the most benefit from this study, it may be more appropriate to view the results in the context of these clusters. 5 of the days have occurred in the past week. Before that, there were 5 other unique clusters. These were the dates and their aftermath.
- October 1969: (The only occurrence that came with the S&P 500 more than 10% from its 52-week high) The index bounced for a month before resuming its cyclical bear market, dropping hard for the following 6 months.
- May 1976: The S&P 500 made a marginal new high 4 months later before dropping steadily for 18 months.
- April 1984: The S&P 500 dropped as much as 6% over the next 3 months before resuming its recently begun secular bull market.
- May 1996: The S&P 500 chopped sideways for 4 months before resuming the blowoff phase of the secular bull market.
- July 2007: The S&P 500 began its cyclical topping formation within 1 week.
Once again, these historical precedents do not guarantee anything regarding the outcome of our present circumstances. However, if there was a message to be gleaned from the prior occurrences, it is a cautionary one. The results were mixed, however, there was certainly more bad than good to come from these tight but volatile ranges.
It remains to be seen what the resolution to our current range will entail. For now, the U.S. stock market hamster continues to spin its wheel – and at a pretty fast pace.
_____________
“The little blue wheel keeps following me” photo by Erik.
More from Dana Lyons, JLFMI and My401kPro.
The commentary included in this blog is provided for informational purposes only. It does not constitute a recommendation to invest in any specific investment product or service. Proper due diligence should be performed before investing in any investment vehicle. There is a risk of loss involved in all investments.


