52-Week Highs Are M.I.A.

** Edited to add the chart at the end.
The subject of today’s Chart Of The Day seems like it may be more a matter of trivia than a relevant market data point. However, upon a little more examination, there may just be a pertinent message behind it. First, the data behind the chart. Yesterday, the stock market quietly achieved a momentous milestone. It has now been exactly 500 days since the number of new 52-week highs on the NYSE hit a 52-week high itself. To put it into perspective, this is now the 8th such streak since 1970.
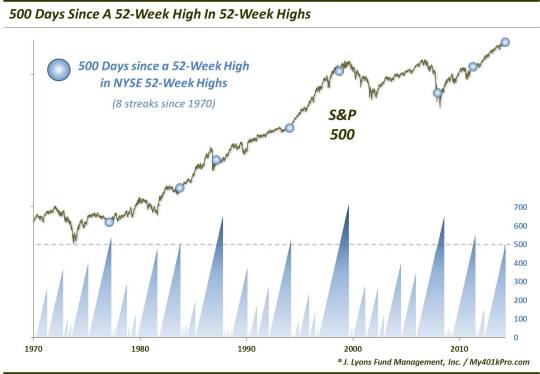
These are the other dates on which streaks without a 52-week high in 52-week highs reached the 500 day marker. Also included is the number of days the streaks reached before being snapped.
- 2/13/1978 (541)
- 10/1/1984 (513)
- 3/3/1988 (659)
- 1/27/1995 (530)
- 9/29/1999 (720)
- 12/15/2008 (652)
- 4/19/2012 (551)
As you can see, 4 of the 7 previous streaks ended within 2.5 months. The other 3 each continued for at least another 150 days. So, based on history, perhaps the odds slightly favor this streak sooner than later. But let’s agree that there is little edge in forecasting the timing of an end to this streak. As we have learned from many other “divergence” type developments that we have looked at, these conditions can persist for a long, and unknowable, length of time.
That said, this is one streak that stock bulls want to see end, as it would mean that 52-week highs have set a new 52-week high. As we have mentioned many times, while it does not guarantee the market will continue rising, the more participation a rally has, the more healthy it is. Thus, more stocks hitting a new high is a positive.
Here is the rub about our current situation. Many of the past streaks were products of the market undergoing a prolonged consolidation of prior gains. Once the next up-leg began, the new highs expanded and the streaks ended. This accurately describes the streaks in 1978 and 1984 and to some extent, 1995 and 2012.
Currently, however, the S&P 500 is sitting near its 52-week high, as it has been for several years. The fact that new highs have been unable to expand in spite of that is troublesome. Furthering that concern is the fact that the 2 other streaks that exhibited similar characteristics were those in 1988 and 1999. Now obviously the 1988 occurrence had seen the market crash already and the 1999 occurrence saw further upside. But while no 2 markets are ever the same, the conditions were somewhat similar.
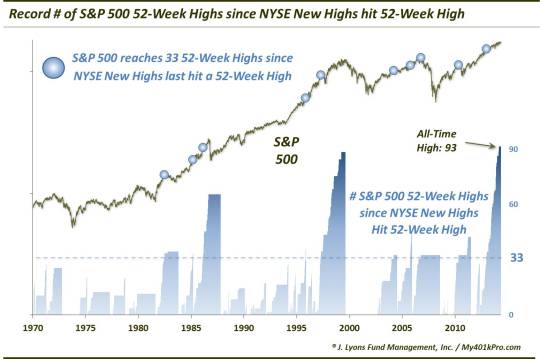
Here’s another way of looking at it. Over the past year, the S&P 500 has made 51 new 52-week highs while, again, the number of NYSE 52-week highs has failed to make a new high. That is by far the most S&P 500 new highs during any one of these streaks listed above. The next closest ones are the 1988 and 1999 versions with 30 and 32, respectively. By the time the S&P 500 had topped in 2000, it had accumulated as many as 34 new highs over a year without a new high in 52-week highs. And get this, at the August 1987 peak before the crash, the S&P 500 had recorded 50 new highs over the prior year. And while the streak without a new high in NYSE 52-week highs was just at 360 at the time, it was the only streak of that length since 1970 that compares with the current one in terms of the number of S&P 500 new highs.
That paragraph was a bit of a tongue-twister so hopefully you were able to wade through it and get the message. That is, a market that continues to make new highs without an expansion of individual stocks making new highs is increasingly vulnerable. And while other streaks historically have gone longer without a new high in 52-week highs, none have done so while the major averages have so consistently made new highs. This is indeed rarefied air and at this altitude, the market could use a breath of new individual highs.
** Chart added: At 93, the number of 52-week highs recorded by the S&P 500 since NYSE New Highs last hit a 52-week high is the most ever.
_____________
“Tumbleweed” photo by Jim Liestman.
More from Dana Lyons, JLFMI and My401kPro.
The commentary included in this blog is provided for informational purposes only. It does not constitute a recommendation to invest in any specific investment product or service. Proper due diligence should be performed before investing in any investment vehicle. There is a risk of loss involved in all investments.


