A Breakout To Nowhere

We’ve spent a good deal of “ink” over the past few months on the trendless, range-bound action that has characterized the U.S. stock market recently. This trading range has been, after all, the dominant factor in the equity market. And an epic, even record-setting, trading range it has been. Our expectations based on much of the research we’ve done has been that once the market broke out of the trading range, it would likely lead to either an out-sized move or a significant jump in volatility. As we put it in a recent post on the Dow’s record streak without a 1-month high or low, “Either way, the resolution of this range should at least provide some fireworks.” Well, if you’re one of those people whose idea of fireworks consists of snakes and sparklers, perhaps the recent breakout above the range has been exciting. For the rest of us, it’s been a real dud. Consider the following.
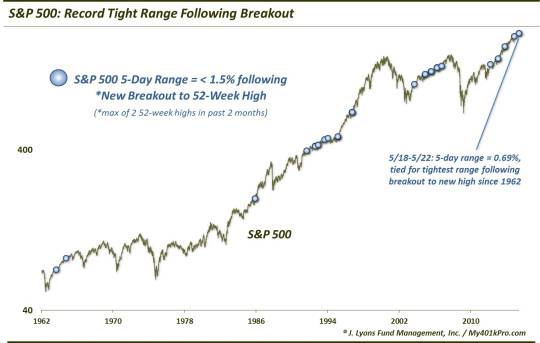
After finally breaking out of the months-long range and setting an all-time high the week before last, the S&P 500 spent the next 5 days trading within a range of 0.69%. That is the 5th tightest 5-range range in the index since 1962. And it is tied for the tightest 5-day range ever following such a breakout to new highs.
So, far from producing fireworks, the breakout instead led to one of the least volatile weeks in the history of the market. Talk about anti-climactic. It was essentially the market equivalent of Geraldo Rivera’s “The Mystery Of Al Capone’s Vaults”. Of course, this was Rivera’s live TV special wherein he orchestrated the demolition of a brick wall supposedly containing the secret stash of Al Capone. Only, instead of the promised loot, the destruction of a succession of brick walls each led to – another brick wall.
In this case, the breakout of the long trading range led to – another trading range. As mentioned, the 0.69% 5-day range was tied for the tightest 5-day post-breakout range in history (along with a stretch in mid-February 1995). It is tough to learn much from one precedent. Therefore, loosening the criteria a bit to ranges of less than 1.5% following a new* breakout to 52-week highs yields 35 days since 1962, as shown on this chart. (*by “new” breakout, we are attempting to isolate true breakouts as opposed to markets that are continuing to make successive new highs. Therefore, we restrict our criteria to occurrences showing no more than 2 other new highs over the preceding 2 months.)
When attempting to interpret the significance of such a lackluster response to a new 52-week high, the arguments generally fall into two categories:
- The lack of follow-through is bearish…or
- Never short a dull market.
We don’t necessarily like to pigeonhole our conclusions into a Wall Street cliche. However, upon reviewing the prior 35 occurrences, we would definitely lean toward the “don’t short a dull market” crowd. Here are the returns in the S&P 500 following the prior examples.
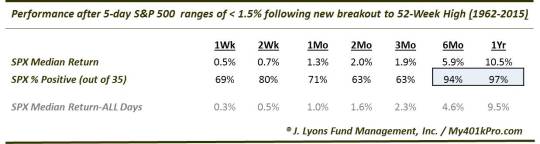
As the table shows, the short to intermediate-term returns following these events were more or less in line with the historical norm. Longer-term, the performance was noteworthy. Although the 6-month and 1-year median returns were just barely above the median returns following all days, the consistency of positive returns has been impressive. Just 2 of the 35 dates saw the market lower 6 months later and only 1 of the 35 was down a year later (that loser, from January 1994, was down just -0.69%.)
From a glance at the chart, it is apparent that these occurrences have tended to take place within steady, persistent uptrends. These markets include the mid-60′s, mid-80′s, mid-90′s, mid-2000′s and post-2012 periods. These periods were all characterized (in general) by low volatility.
And while it is true that market tops are formed amid low volatility, there is usually at least a relative uptick in volatility as the top is forming. This often involves some fireworks in the form of a more exciting and enticing spike to new highs prior to the market’s ultimate failure. Tops do not typically materialize out of dull, listless range-bound markets with all the excitement of a sparkler or Geraldo TV special.
A we have said countless times, while we have our concerns about this market, based on the historical results, this study isn’t one of them.
_____________
More from Dana Lyons, JLFMI and My401kPro.
The commentary included in this blog is provided for informational purposes only. It does not constitute a recommendation to invest in any specific investment product or service. Proper due diligence should be performed before investing in any investment vehicle. There is a risk of loss involved in all investments.


