Despite Historic Compression, Stocks Remain Range-Bound

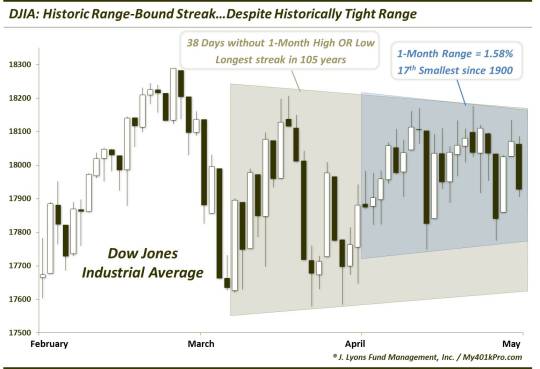
On April 24, we posted what we thought (and hoped) would be our final post concerning the stock market’s lengthy trading range. In the post we noted that for only the 8th time in 100 years, the Dow Jones Industrial Average (DJIA) had made it to 30 days without hitting either a 1-month high or low. It was, in our view, a pretty remarkable stat. Little did we know, however, that 8 days later, the streak would still be alive. And at 38 consecutive days, it is now the longest such streak in at least 100 years. The only longer streak in history occurred in 1910 and lasted 45 days (although the daily data from that era is a little sketchy so it’s possible that our current streak is the longest ever.)
That milestone alone would justify an update to the April 24 post. However, there is yet another angle to this streak that is pretty remarkable. The current 1-month range in the DJIA is a very tight 1.58%. It is so tight in fact that it accounts for the 17th narrowest 1-month range since 1990. For those scoring at home, that places it in the 0.6th percentile of all 1-month ranges. In that context, the DJIA’s record streak without a 1-month high or low is that much more amazing considering how low the bar has been for achieving a new high or low.
Consider this: of the other 7 streaks of 30 days without a 1-month high or low over the past 100 years, the average 1-month range was nearly 5%. Only 1 other streak had a range as low as even 2.50%.
On the flip-side, what of the 16 1-month ranges historically that have been tighter than our current conditions? Did they see streaks without a 1-month high or low of any significant duration? Well, 2 of the 16 did see streaks of 23 and 25 days. However, the average streak of the other 14 was about 4 and just one went at least 12 days.
So it is readily apparent that streaks this long without a 1-month high or low are extremely rare. It is also extremely rare to see a 1-month range in the DJIA as tight as 1.58%. It is flat-out unprecedented to see the DJIA on such a streak while also within such a tight range. Again, the bar for setting a 1-month high or low has been very low for the DJIA, yet it has been unable to achieve one. This provides context to how truly historic the current range has been.
Unfortunately, we cannot compare outcomes following similar markets since, well, there have not been any. And to be honest, it is difficult to draw any conclusions, forecasts, value, etc. based on this historic streak and range outside of simply a bit of trivia. One would think that due to the length and amount of the market compression that it would explode one way or another once the streak was broken. However, as we have seen in this post, anything can happen.
Hopefully now this is our final post on the topic of the recent trading range. If we go another 8 days inside this range, frankly I’m going to start getting a little scared.
_____________
“one of my vices” photo by Robert S. Donovan.
More from Dana Lyons, JLFMI and My401kPro.
The commentary included in this blog is provided for informational purposes only. It does not constitute a recommendation to invest in any specific investment product or service. Proper due diligence should be performed before investing in any investment vehicle. There is a risk of loss involved in all investments.


