Final Pillar Of Bull Market Showing Cracks?

We have repeated ad nauseam the litany of concerns we have regarding the longer-term fate of the U.S. stock market. These concerns include metrics pertaining to price proximity to trend, valuation, sentiment, investor allocation, investor leverage, corporate profligacy and on and on and on. Our biggest problem with these conditions are that such excesses of the prior secular bull market, in our view, were not adequately corrected in the subsequent secular bear market. Thus, we find it a reach to consider that the necessary conditions were in place to support a new sustainable secular bull market – particularly one in which many of the same excesses have so hastily reemerged. That said, we have also taken great care to emphasize the one factor which has remained favorable and which trumps all of the concerns above: price action. Unfortunately for the bulls, this last and most crucial pillar of the bull market is now too potentially showing signs of vulnerability.
The most bullish thing stocks can do is go up, especially to an all-time high. And as recently as last month, many of the broad stock averages were continuing to make new highs, including the Russell 2000 small cap index, the NYSE Composite, the S&P 500 Equal-Weight Index and even the NYSE Advance-Decline Line. This was important as it showed that the persistence of the bull market rally was evident across a wide range of stocks, not just a few top-heavy large cap indexes.
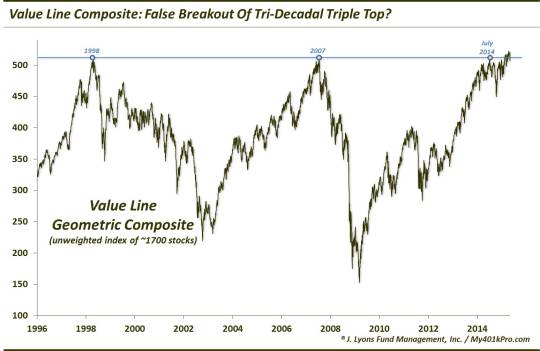
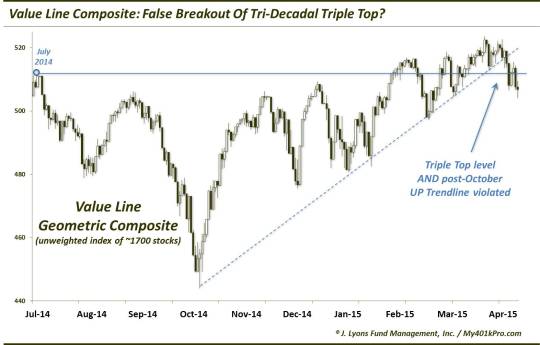
Another broad index at new highs was the Value Line Geometric Composite (VLG). The VLG is an unweighted index of approximately 1700 stocks and is a favorite of ours in gauging the level of participation among the broad universe of stocks. We posted a piece on it July 2 of last year noting the fact that it was bumping against the same level that saw the index top out at in both 1998 and 2007. Sure enough, the VLG peaked the very next day, setting up the makings of a possible but most improbable 16-year triple top. That July peak held until February when the index finally broke above the triple top level. After a test of the breakout level in March, the index moved to new highs again in April. However, over the last few weeks, the VLG’s triple top breakout has shown initial signs of cracking.
The recent bout of market weakness has hit the small cap stocks especially hard. This has had an impact on the VLG. Not only has the index now lost the level signifying the 16-year triple top, it has also violated the up trendline from the October low of last year.
Now of course this weakness is very short-term and does not guarantee the longer-term failure at these levels. That is why we say it is showing “initial” signs of cracking. Who knows, the index could be up 4% next week to an all-time high and this development will be irrelevant. However, considering the level at which this weakness is occurring as well as the list concerns already in place, the risk is that this too will develop into trouble of a longer-term nature. It would also put the 16-year triple top potential back on the table considering the possible false breakout.
This, again, is just a preliminary breakdown in price. However, it is concerning as positive price action has been the one remaining pillar supporting the bull market – and the only one that can overcome all of the ancillary concerns pertaining to stocks. However, it too is potentially starting to show some cracks.
_____________
“Athenian pillars” photo by Jef Jones.
More from Dana Lyons, JLFMI and My401kPro.
The commentary included in this blog is provided for informational purposes only. It does not constitute a recommendation to invest in any specific investment product or service. Proper due diligence should be performed before investing in any investment vehicle. There is a risk of loss involved in all investments.


