More Weight Added To Equity Bear Case

For the past 12 months, we have been taking note of a gradual accumulation of ancillary factors suggesting the longer-term outlook for stocks was becoming less attractive. At the same time, the factors most vital in supporting the persistence of the bull market in the intermediate-term continued to be constructive. As we mentioned yesterday, though, that has started to change. Today, we offer another example of an important gauge of stock market health that is beginning to show cracks: the Equal-Weight S&P 500 Index.
As the name implies, the Equal-Weight Index applies an equal weighting to all of the components in the index, regardless of price or market cap. Taking this more democratic view of the index makes it easier to assess how strong the broader “market” really is versus the cap-weighted S&P 500 Index, which may be supported by a relatively small number of its biggest constituents.
The last time we looked at the Equal-Weight Index (by way of the Guggenheim Equal-Weight S&P 500 ETF, ticker RSP), was at the end of March. That post noted a positive development as the ratio of the index versus the cap-weighted S&P 500 SPDR (SPY) had just broken out to an all-time high. This suggested that the broad market was still quite healthy. As today’s Chart Of The Day reveals, however, things have changed.
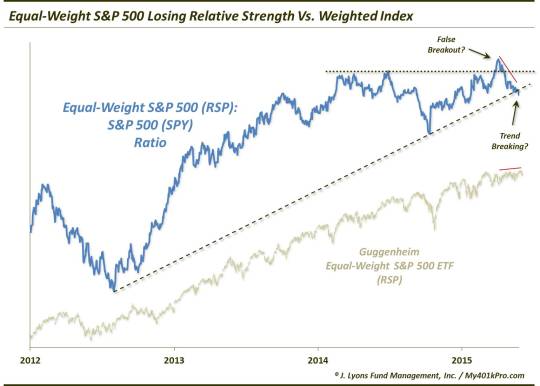
Despite the Equal-Weight RSP’s new price high in May, there are a number of negative developments on the chart regarding its ratio versus SPY:
- The March breakout in the RSP:SPY ratio was not sustainable. 2 weeks later, the ratio was back below its highs of February-April 2014, June 2014 and February 2015, creating a likely “false breakout”.
- RSP’s May price high was not confirmed by a new high in the RSP:SPY ratio.
- The RSP:SPY ratio has broken its post 2012 UP trendline (of course, we are breaking our own trendline rule of requiring at least 3 points of contact to constitute a valid trendline. However, even if it is not significant, the break is not a positive.)
It is true that this “ratio” breakdown between the Equal-Weight S&P 500 and the cap-weighted index is still based on a 2nd-derivative measure. The true warning sign will be a breakdown of price itself. However, the warnings are getting closer as this ratio is at least based on prices. Thus, we deem it to be more relevant and significant in assessing the market’s prospects than the ancillary concerns pertaining to things like valuation, sentiment, investor allocations, etc. Furthermore, the ratio does have a track record as a reliable gauge of broad market health.
Therefore, with signs of cracks in the Equal-Weight S&P 500′s relative performance, we have more evidence that all is not necessarily as rosy as it may seem with the major averages near all-time highs.
________
“Vintage Scales” photo by Cool Kats Photography.
More from Dana Lyons, JLFMI and My401kPro.
The commentary included in this blog is provided for informational purposes only. It does not constitute a recommendation to invest in any specific investment product or service. Proper due diligence should be performed before investing in any investment vehicle. There is a risk of loss involved in all investments.


