Stock Indicator Suggests Big Move (Lower?) Coming

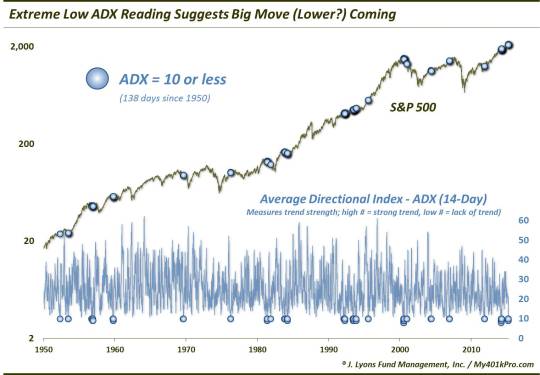
We don’t talk too often (because we don’t use them) about traditional technical analysis indicators. We have nothing against them; it’s just that we have our own methodologies and processes that work for us. One indicator we do like to keep an eye on is the ADX, or Average Directional Index. It is essentially an indicator of the strength (or lack of strength) of the prevailing trend over a specified period, regardless of the trend’s direction. A high number indicates a strongly trending market and a low number reflects a lack of trend. The traditional default look-back period is 14 days so we tend to stick with that. Interestingly, recent readings of the 14-day ADX applied to the S&P 500 have been among the lowest of the last 65 years, indicating an extremely “trendless” market.
Given the recent range-bound action in U.S. stocks (which we’ve covered extensively), this isn’t too much of a surprise. Indeed, it is another way of measuring the existence, and persistence, of a trading range. As mentioned, though, this lack of trend has been especially noteworthy. On several days over the past 2 weeks, the ADX reached a reading of 9. Since 1950, there have been just 42 total days – or ¼ of 1% – that saw the ADX that low. Expanding the net to readings of 10 or lower yields 145 days, still less than 0.9% of all days since 1950.

What is the significance of ADX readings this low, besides obviously that the market has been trendless over the recent period? Well, they say that low-volatility markets beget high-volatility markets. And while that sounds like another trite Wall Street cliche, it does seem to have some validity. Witness the ultra-low volatility periods in the U.S. Dollar and the Shanghai Composite early last year which led to explosive moves. Therefore, a market wound this tightly – like a coiled spring – may be setting up for an especially big move, one way or another.
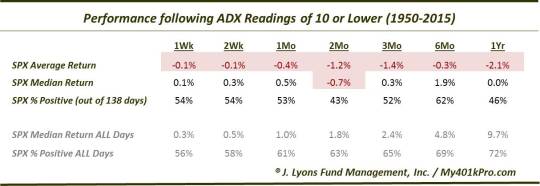
We say one way or another, but a look the historical precedents suggests a strong possibility that the move will be lower. For while a low ADX signifies lack of trend in either direction, historically, the moves following such readings have been surprisingly skewed to the downside – or at least below average. Here are the returns in the S&P 500 following ADX readings of 10 or less since 1950 (138 instances before the recent readings).

What accounts for such poor returns following low ADX readings? Well, it is probably a function of when such low ADX readings tend to occur rather than a byproduct of the low readings. That is, these trendless markets often occur near transitional “topping” periods. During these periods, volatility (or at least, movement) is extremely low in contrast with bottoming periods, which tend to be volatilie, whippy type affairs.
We often filter these studies to look at the results for markets that were trading near the 52-week high. This study makes that extra step unnecessary as that characteristic is true for most of the readings. Of the 145 ADX readings of 10 or less since 1950, the median distance of the S&P 500 from its 52-week high was just 1.9%. And just 7 of the 145 days saw the S&P 500 further than 10% from its 52-week high.
There were a few exceptions to the weaker-than-normal returns following these readings. Like many of the studies we’ve looked at recently, those exceptions came during the mid-1990′s and in the post-2013 era. The S&P 500 saw healthy gains after such instances. Again, though, those were the exception rather than the rule. Many more of the readings, historically, have come near tops of intermediate to cyclical significance, including 1956, 1959, 1969, 1976, 1981, 1983, 2000, 2001 and 2007. Thus, the weight of the evidence is heavily skewed to a negative outcome.
The Average Directional Index, or ADX, is an indicator of “trend strength”, regardless of direction. Recently, coincident with the range-bound trade, the ADX registered among the lowest readings on record. This directionless coiling up of the market suggests that is is about to move one way or the other in perhaps a big way. Historical readings like this, however, have been more consistent in leading to poor performance in the S&P 500 rather than necessarily an out-sized move in some direction. The signal hasn’t been unanimous in foretelling weak performance, but it has certainly been the norm over the past 65 years, and to a statistically significant degree. Thus, we would consider this another negative facing the stock market at the present time.
_____________
“Coil” photo by Rob Witcher.
More from Dana Lyons, JLFMI and My401kPro.
The commentary included in this blog is provided for informational purposes only. It does not constitute a recommendation to invest in any specific investment product or service. Proper due diligence should be performed before investing in any investment vehicle. There is a risk of loss involved in all investments.


