What Is The Grand-Daddy Of Divergences Telling Us Now?

Today, we continue (and possibly end) our series on market “divergences”. These of course represent a condition wherein one index goes to a new high while another index, or indicator, fails to do so. As we have stated, for various reasons we feel that divergences are over-utilized as an investment input. The problem is that a divergence is a condition, not a catalyst. Therefore, it is tough to accurately “time” the potential benefit offered by a divergence. And furthermore, as we saw with the much ballyhooed “Dow Theory” divergence between the Industrials and the Transports, all too often there is no benefit at all.
Therefore, if one is to attempt to employ divergence analysis in their investment decisions, they should at least do some research into what divergences, historically, have actually been useful. One effective divergence that we found was between the Dow Industrials and the Dow Utilities. But the grand-daddy of all stock market divergences (as determined by us), is not based on an index. It is based on an indicator, namely the Advance-Decline Line on the NYSE. This indicator is a running cumulative total of the daily difference between advancing issues on the NYSE and declining issues. If this “A-D” Line is keeping pace with the market and printing new highs along with the stock indexes, it represents strong participation within the broader market. And as we have said before, the better the participation, the healthier the market.
This has been the case during most of the rally of the past few years, as we touched on in a January post. Over the past month, however, we have seen a possible change of character. While the S&P 500, for example, has gone on to new highs this week, the NYSE A-D Line has not yet surpassed its April highs. And while the S&P 500 is merely days into a new high, and the NYSE A-D Line is easily within striking distance of its previous high, the fact that it has not made a coincident new high represents different behavior on the part of the indicator.
But the real story lies in the indicator’s track record regarding divergences. There is a reason why we call it the grand-daddy of divergences and a reason why it is perhaps the only potential source of divergences that we monitor:
The NYSE Advance-Decline Line has negatively diverged before every cyclical top in the S&P 500 since 1966.
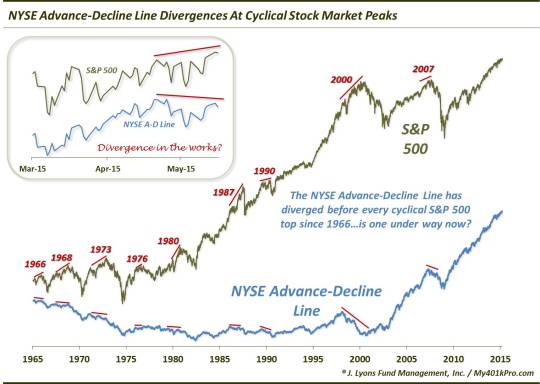
While the magnitude and the lead-time have varied, every single major cyclical top since 1966 has occurred with the A-D Line below its prior peak. Now, these divergences have typically spanned periods longer than the 1-month that describes our current situation. The “norm” is for the market to sell off for several months before rallying back to make a higher high – and ultimate top – while the NYSE A-D Line simultaneously fails to record a higher high.
Therefore, perhaps we are jumping the gun a bit on the “divergence suggesting a cyclical top” argument. More concerning, longer-term, would be a scenario in which the market suffers a sizable pullback before recovering to a new high concurrent with a clear lower high in the A-D Line. However, again, this current lower high thus far represents a subtle change in character in the indicator’s behavior and is perhaps more of a short-term concern.
Whatever happens within this near-term development, the NYSE Advance-Decline Line will continue to be the one data series that we monitor for possible divergences. There is no guarantee that every peak in the future will be accompanied by an A-D Line divergence. However, it has a flawless historical track record of being useful in that capacity, at least at major market tops. That is saying something considering all of the useless divergence conjecture often espoused.
_____________
Tree photo by Miwok.
More from Dana Lyons, JLFMI and My401kPro.
The commentary included in this blog is provided for informational purposes only. It does not constitute a recommendation to invest in any specific investment product or service. Proper due diligence should be performed before investing in any investment vehicle. There is a risk of loss involved in all investments.


