With Banks At New Highs, Are Stocks Out Of The Woods?
With the major indexes again pushing up near new highs, it is a good reminder that despite all of the ancillary concerns about the market (many of them voiced by us), the trump card ultimately is price. And while there have been some potential cracks recently on that front, by and large, the trend remains solidly up, or at least solidly “not down”. One of the concerns that others have voiced has been the relative weakness in bank stocks, specifically in their inability to make any new highs yet this year. Well, you can cross that red flag off the list now as the KBW Bank Index (BKX) did hit a new 52-week high yesterday for the first time since December. So with that impediment out of the way, are stocks in the clear now? Based on one current set of conditions, that might not be the case for one segment of the market – but not the one you’d think.
While the BKX did finally score a new high yesterday, other areas of the market have taken over the “laggard” mantle. One such segment is the Russell 2000 small-cap index (RUT). The struggles of the RUT of late is one of the potential “cracks” in the otherwise favorable price situation. Given the recent sharp rise in interest rates, it isn’t too surprising to see the relative reversal of fortune between bank stocks and small-caps. Or perhaps it is simply another of the many examples of market leadership rotation that has continued to sustain this bull market. Whatever the reason, the degree of the BKX-RUT divergence is noteworthy.
Specifically, while the BKX is at a 52-week high, the RUT is 3.38% away from its 52-week high. Since the origin of the BKX and the Russell 2000, this large of a divergence has only taken place on 10 other unique occasions.
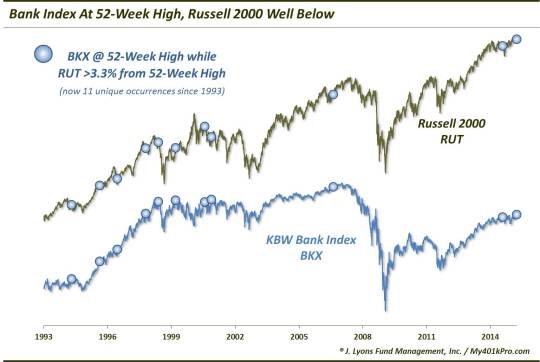
Like all divergences, this one has, at times, persisted for some time, with several occurrences showing multiple readings. The following dates, however, are the months of the initial divergence in the previous 10 instances
- June, 1994
- October, 1995
- August, 1996
- December, 1997
- July, 1998
- April, 1999
- September, 2000
- January, 2001
- September, 2006
- September, 2014
Eventually following these divergences, one of the indexes has run into significant longer-term trouble more times than not. Meanwhile, the other index saw little in the way of adversity, at least in the intermediate to long-term. The thing is, the index that saw weak results and the index that fared much better are not the ones you would think. Despite being the index at the 52-week high, surprisingly, the KBW Bank Index has had an ignominious track record following the divergences.
Here is a table of the BKX’s aggregate performance in the aftermath of the previous 10 occurrences.
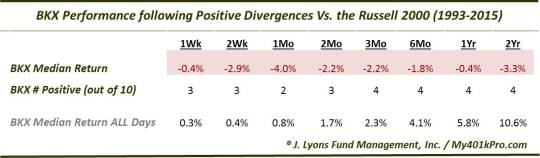
Over no duration did the BKX result in more positive returns than negative returns. Only 2 of the 10 occurrences saw the BKX higher one month later while the median return was -4%. And incredibly, even after 2 years the BKX was lower in 5 of the 9 instances that had enough data to register a figure. Incidentally, the 5 occurrences with negative 2-year returns happen to be the last 5, before 2014. The 4 occurrences from 1994-1997 resulted in an average 2-year gain of +57%. Meanwhile, the 5 occurrences from 1998-2006 averaged a 2-year return of -18%. This is not the outcome we would have expected to see.
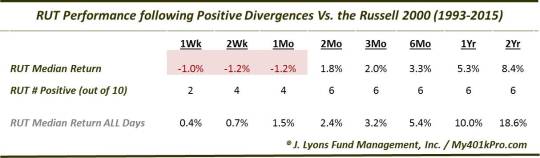
Meanwhile, after some short-term hiccups, the Russell 2000 – the index negatively diverging in this study – has not fared too poorly after these divergences. Witness the RUT’s performance:
Sometimes these studies do not produce the results one would expect. That is the point of research. Even accepting that past performance does not guarantee similar results, no matter how similar the study periods may appear, this kind of research is worthwhile. At a minimum, it helps remove preconceived notions or biases about how a market should behave under certain circumstances.
In this case, historical divergences between the KBW Bank Index (at 52-week highs) and the Russell 2000 small-cap index (well below 52-week highs) have produced very sub-par results for one of the sectors. Surprisingly, though, it is the bank stocks that have suffered afterward, not the small-caps. Thus, the attainment of a 52-week high, under these conditions, may in fact be a cautionary sign for bank stocks rather than an all-clear sign for the broader market.
_____________
“Lincoln Savings Bank” photo by michaelgoodin.
More from Dana Lyons, JLFMI and My401kPro.
The commentary included in this blog is provided for informational purposes only. It does not constitute a recommendation to invest in any specific investment product or service. Proper due diligence should be performed before investing in any investment vehicle. There is a risk of loss involved in all investments.


