Is Relative Spike In Nasdaq Internals A Major Buy Signal?

We spend quite a bit of time researching (i.e., messing around with) various data sets looking for an edge in the markets. In this pursuit, we often come across signals, or developments, in the data that, while perhaps noteworthy, are likely a product of coincidence or best suited for the trivia pile. Occasionally, however, we will come across a signal that holds genuine promise for its usefulness in aiding our battle with the markets. The subject of today’s Chart Of The Day may be just such an indicator.
We have noticed in the last few days and weeks that the New Highs/New Lows situation on the NYSE appeared to be weakening. That isn’t surprising considering the weakness in bonds as well as stocks. At the same time, though, the New Highs/New Lows situation on the Nasdaq was improving, even despite the weak action in the Nasdaq Composite as well. After playing around with the data a bit, we came up with a pretty interesting angle to this data. We took the number of New Highs minus New Lows on the Nasdaq (as a percentage of total Nasdaq stocks) and subtracted the differential between New Highs and New Lows on the NYSE (again as a % of total NYSE stocks). The resulting figure gives us an idea of the relative improvement or deterioration of the Nasdaq internals versus the NYSE internals.
As mentioned, with the recent improvement in the Nasdaq figures, it is no surprise to see this indicator spike higher with 2 of the last 3 days showing readings over +5.5% (i.e., the differential in Nasdaq New Highs-New Lows MINUS the differential in NYSE New Highs-New Lows was over 5.5%). What was somewhat surprising to us was the location of many of the similar signals historically.
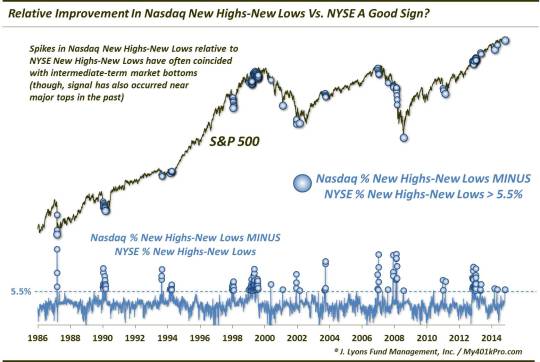
Interestingly, readings over 5.5% have coincided with nearly all major intermediate-term and cyclical lows since 1986. Such lows include 1987, 1990, 1994, 1998, 2001, 2002, 2009 and 2011 as well as October and December 2014. Perhaps even more interesting has been the lack of false readings during this time, with the exception of some occurring in late 1999, 2004 and 2013. Other than those, essentially all of the other readings occurred at major lows, or on the way to major lows.
Now, “on the way to major lows” is a not a phrase to be glossed over. “On the way” can be another term for “early” and in this business, early can be wrong. And early in a bear market can be painfully wrong. Indeed most of the signals here that were early occurred within the throes of major declines, including 1987, 1990, 1998 and 2008. And although many of the “early” signals were only early by a few days (other than 2008), those few days were devastating. It was during these declines as well that we saw this indicator rise well beyond 5.5%, reaching 10% and even 20% on occasion. Thus, let that serve as a warning that this signal can rise much higher than 5.5%. And let it be a reminder that no signal is perfect.
Additionally, a few occasions, namely early-2000 and mid-2007, occurred very near cyclical market tops. Now those were accompanied by some minor short to intermediate-term weakness so the signals were not total misfires. However, they obviously did not mark major lows. Instead they were minor lows within a topping cyclical market. Therefore, the duration of these signals’ effectiveness has varied depending upon the market. It is, thus, not out of the realm of possibility that the present signals may coincide with lows of some short-term significance (especially considering the very modest level of selling so far), while not having much positive impact in the intermediate to longer-term picture.
One last point and it may seem like a trivial one. But it might be the most important takeaway of the entire post. The source of many of the spikes in relative Nasdaq New Highs-Lows versus NYSE New Highs-Lows that served as accurate markers of significant market lows were not a result of improving Nasdaq internals. Rather, they were a result of exceptionally bad NYSE internals. This leads an important point that is consistent with a body of evidence we’ve witnessed throughout our research: when looking for capitulation, look at the NYSE. Nasdaq internals can certainly get “washed out”. However, at major lows in the market, it is on the NYSE that we have witnessed an acceleration of selling and internal deterioration that reach a tipping point, signifying true capitulation. We don’t know why this is the case, but is has been in our experience. So that’s something to keep in mind.
As far as our present signal is concerned, it somewhat odd, again, considering the minimal selling that has taken place. One reason for the signal is the genuine improvement in the Nasdaq New Highs-New Lows. Now it isn’t anything overly impressive on an absolute basis but it is noteworthy considering the selling in the indices the past several days. Perhaps not coincidentally, a few of the rare “false alarms” in the indicator, in 1999 and 2013, occurred in large part because of improvement in the Nasdaq internals rather than a capitulation on the NYSE. Those instances did not see the type of selloff that would seem to elicit a capitulatory event. But while neither of those occurences led to major botoms, they did result in several more months of grinding action to the upside.
Whether or not the somewhat unusual circumstances surrounding this current signal disqualify it from among the ranks of those marking major lows, we cannot be sure. We do have our suspicions, however. But regardless of whether or not it applies appropriately in this instance, this is one indicator that appears to hold promise in identifying significant market lows. Thus, it is one that is probably worthwhile keeping in our technical analyst toolbox (as unorthodox as ours may be).
________
“Pogo Stick Champion Donald Saboe Jr.” photo from LIFE Magazine archives.
More from Dana Lyons, JLFMI and My401kPro.
The commentary included in this blog is provided for informational purposes only. It does not constitute a recommendation to invest in any specific investment product or service. Proper due diligence should be performed before investing in any investment vehicle. There is a risk of loss involved in all investments.


