“Major” Equity Index Breaking Down?

For all of the longer-term, ancillary red flags and concerns that have materialized in the latter portion of this cyclical bull market (many of which, we have laid out), bulls have had the same response: price is all that matters. It is the appropriate response. Unless one is making prop bets on economic data or has located a Dow Theory Divergence Futures contract, they are relegated to relying on asset prices in determining their investment fate. It appears to us, however, that a great many bulls preaching “price patience” have failed to recognize one thing: there is already evidence of a breakdown in prices. The “stock market” consists of many segments, not just the S&P 500, So it depends where you are looking.
For example, the alluded to Dow Transportation Average and Dow Utilities as well as some other broader indices have already begun to exhibit price breakdown characteristics (i.e., lower highs and lows, drops below key moving averages and support levels, etc.) Today’s Chart Of The Day brings another example of an index potentially breaking down: the NYSE Major Market Index (XMI).
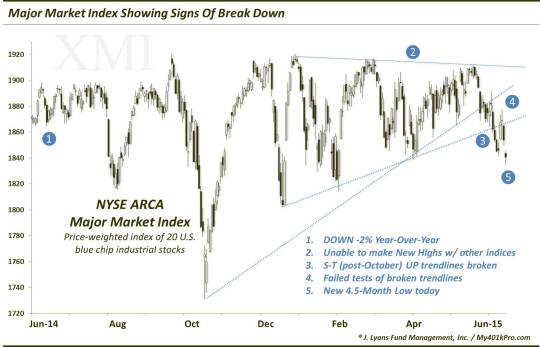
The XMI is an index of 20 of some of the largest blue chip industrial stocks in the U.S. market. So it isn’t exactly the broadest index. However, it is influential, in terms of its constituents’ big “name” influence as well as their “weighty” impact on many of the averages. Why are we concerned about the price action in the Major Market Index? Here’s a list of some of the reasons.
- The XMI is actually DOWN -2% year-over-year. Therefore, despite the proximity of the popular indices near their all-time highs, there has been at least stealth stagnation for some time in portions of the market.
- The XMI was unable to make new highs along with some of the other indices in April and March. In fact its only new high of 2015 came on March 2 – by .019%. This also means that the index is making lower highs.
- The XMI has broken down below its post-October UP trendlines, both the steeper one originating at the October lows as well as the shallower one connecting the series of lows since. For now, this is only a short-term development. However, it is a negative price development that could lead to further price deterioration.
- The XMI has already failed in tests of the underside of both of the aforementioned broken trendlines. Therefore, it had a shot at turning into a “false breakdown”, and failed that.
- The XMI made a new 4.5-month low today. Not only did it close below last week’s low, but it has also closed below the short-term lows from March and April. This places a series of lower lows on the chart. And while it could always reverse course higher again, it now is in a “definitive” downtrend, on a short to intermediate-term basis.
So, will this breakdown lead to further deterioration in price or will be another in a long list of fakeouts occurring over the past 12 months? That is the six-million dollar question. Of course, nobody knows the answer to that. However, these developments in the Major Market Index represent unequivocally negative price action. So for those preaching patience in deploying defensive measures until price breaks down, let this serve notice. The stock “market” is not merely one index – there is already ample evidence of price breakdown taking place.
________
Photo of Lee Majors, the “Six-Million Dollar Man”.
More from Dana Lyons, JLFMI and My401kPro.
The commentary included in this blog is provided for informational purposes only. It does not constitute a recommendation to invest in any specific investment product or service. Proper due diligence should be performed before investing in any investment vehicle. There is a risk of loss involved in all investments.


