Record Margin Debt: Tailwind Or Bubble?

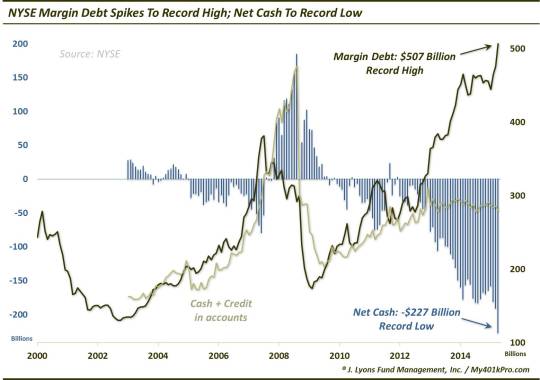
The topic of margin debt always seems to be the source of much debate by market observers. Folks seem to fall on one of two sides of the debate. Either rising margin debt is 1) a tailwind for stocks as it is a sign of investor demand and available credit, or 2) it is a bubble waiting to pop, which will lead to carnage in the stock market. The debate will likely be heightened (as it already appears to be) due to the latest reading on margin debt levels at the NYSE. As our Chart Of The Day shows, margin debt in April jumped 6.5% to a new all-time record $507 billion.

The record high margin debt is not the entire story, though. One of the market researchers we greatly respect, Jason Goepfert at sentimentrader.com, has often – and correctly – pointed out that there is another side of the ledger: the amount of available investor cash and credit. It is one thing to see margin debt at elevated levels. If investor cash+credit is rising along with it, however, the leverage picture isn’t really changing. We saw that scenario for much of the 2005-2006 and 2010-2012 periods.
Since hitting a post-Financial Crisis peak in December 2012, however, investor cash+credit has stagnated. Meanwhile, margin debt has continued to soar. As a result, not only is margin debt at an all-time high, investor “net cash” (cash+credit minus debt) is at an all-time low…by a mile. With last month’s jump in margin debt combined with a slight decrease in cash+credit, investors’ net cash plunged 19% below already record-low levels.
So which side of the margin debt debate do we come down on? Well, you may have detected that we do view the margin debt/net cash situation as a longer-term concern of “bubbly” proportions. However, the rising margin debt is also a tailwind for the market…as long as it continues heading up. The problem comes when it stops rising.
When will that be? Others have pointed out that at the past 2 cycle tops in 2000 and 2007, margin debt peaked in advance of the market and served as a canary in the coal mine of sorts when it did not confirm the market’s new highs. This is true, based strictly on monthly closes in the S&P 500. However, that is only 2 data points. Furthermore, margin debt peaked in March of 2000 with the Nasdaq blowoff and in July 2007 along with several sectors of the market. Therefore, one could argue that margin debt peaked concurrently with “the market”.
Looking historically, the correlation coefficient between monthly closes in the S&P 500 and margin debt levels is 0.91. This suggests to us that margin debt moves concurrently with stocks. Therefore, it will quite likely peak along with stocks rather than serve as some sort of canary. Thus, we would not necessarily be focused on the margin debt situation for signs of a market top.
Does that mean that margin debt and negative investor net cash readings that are far into record territory are irrelevant? Perhaps at the moment, but ultimately, no. Our assessment of the margin debt situation – like many of the other longer-term background type indicators – is that it is a measure of potential market risk. When margin debt gets unwound, it turns from a tailwind to a headwind for the market. And considering the massive record levels of margin debt, it could become a substantial headwind, eventually.
So is record margin debt a tailwind or a bubble? Yes. As long as it continues to rise, it is a tailwind. However, market declines will produce margin selling. Therefore, whenever the next substantial market decline begins, the deflating bubbly debt levels will necessarily exacerbate things. At that point, the large potential risk represented by record margin debt levels will turn into manifested risk.
________
“Bubbly Wind” photo by Marc Joseph Gerland Marasigan.
More from Dana Lyons, JLFMI and My401kPro.
The commentary included in this blog is provided for informational purposes only. It does not constitute a recommendation to invest in any specific investment product or service. Proper due diligence should be performed before investing in any investment vehicle. There is a risk of loss involved in all investments.

