Add Junk Bonds To The Growing Pile Of Concerns

This week’s Charts Of The Day and blog posts have had a heavy bearish bent to them. That isn’t by design. We just go where the data leads us and much of the data, in our view, is skewing to the bearish side for equities. Included in the concerning assortment of data are many examples of weakening stock market internals. That isn’t the only concern, however. As today’s Chart Of The Day illustrates, you can also add high yield, i.e., “junk”, bonds to the growing list. Junk bonds, as the name implies, represent the lesser credit-worthy entities in the space. Thus, they carry a higher yield that higher-grade bonds.
Because of their credit issues, these bonds often trade more closely with equities than they do with base interest rates. Occasionally, however, junk bonds and stocks will diverge with one another. Such a divergence is occurring at the moment. It is often suggested that when the bond and stock markets diverge, the bonds typically prove to be correct, i.e., the stock market usually ends up going the way of the bonds. Is there evidence to back that up? According to our research there is, at least following conditions similar to those at the present time. And, for stock bulls, that isn’t necessarily good news.
What are the conditions? Well, despite the tendency to move together, junk bonds are currently near recent lows while stocks remain near their highs. Specifically, junk bond rates (which move in the opposite direction as prices) closed at a 6-month high yesterday, as measured by the BofA Merrill Lynch US High Yield Master II Effective Yield. At the same time, as of yesterday the S&P 500 was within 1% of its 52-week high. This set of conditions has only been seen on 21 previous days going back to 1997.
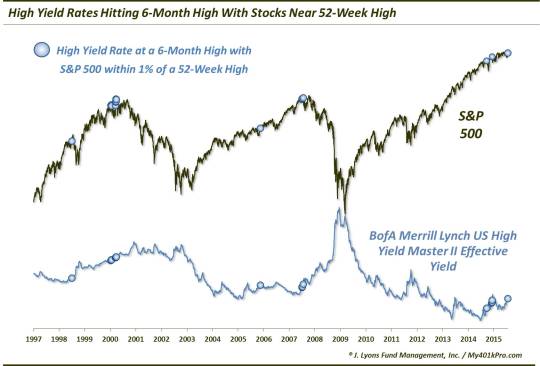
As the chart markers indicate, the timing of the prior occasions meeting these conditions were not too too favorable for stocks. These were the dates of those occasions (many of them were clustered closely together):
- June 30, 1998
- January 10-19, 2000
- March 16-27, 2000
- November 17, 2005
- July 3-9;27, 2007
- September 24, 2014
- December 5-9, 2014
- July 22, 2015
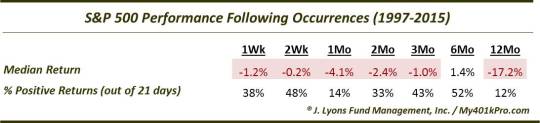
You don’t have to be a market historian to notice several inauspicious dates in that list for stock investors. The fact is, except for the 2005 occurrence, it was a rough ride for the stock market, following each of the others, at least on some duration. Following the 1998 and earlier March 2000 and July 2007 events, the S&P 500 was able to stave off immediate harm for a few weeks before getting hammered. The other events exhibited weakness almost immediately. And even though the S&P 500 has since recovered following the events in September and December of last year, the index did suffer sharp losses in the subsequent weeks. In all, after 1 month, just 3 of the 21 occurrences saw the S&P 500 higher, and a median return of -4.1%.
The longer-term picture was just as bad, if not worse than the short-term. The jury is obviously still out on the 2014 events. Among the others, only after the 1998 and 2005 occurrences was the S&P 500 was able to post a gain 1 year later – or even 2 years later. The others, obviously marking cyclical tops, were all much lower. In all, these occurrences resulted in median 1-year losses of -17.2% and median 2-year losses of -23.6%. Here are the specific numbers:
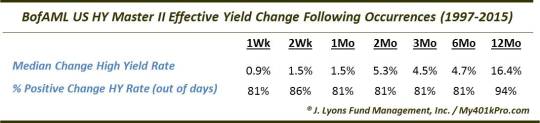
The returns in junk bonds following these events were not much better. Already at 6-month highs in rates, high yield rates typically kept rising afterward. The continued rise was incredibly consistent as well. 3 days after the events, just 5 of the 21 occurrences saw high yield rates lower. And that was the best-performing time frame! From 4 days to 2 years later, no more than 4 of the dates saw a drop in rates. So, in terms of junk bonds, this signal was more of a beginning than an end. Here are the specific % changes in high yield rates:
We have laid out a litany of concerns this week related to the current ugly stock market internals. By some measures, the breadth has been the thinnest on record for the U.S. market. Even some of the stronger areas of the market are beginning to weaken. To that list of concerns, we can now add the action in the junk bond market. Historically, when junk bonds have shown an extreme negative divergence while stocks were near their 52-week highs, stocks have almost unanimously succumbed to weakness as well. And while at times, that weakness was only short or intermediate-term in nature, it also preceded the cyclical peaks in 2000 and 2007. If the current market is to follow those precedents you might find stocks in the scrap heap a year from now.
______
“Scrap” photo by Anthony Furlong.
More from Dana Lyons, JLFMI and My401kPro.
The commentary included in this blog is provided for informational purposes only. It does not constitute a recommendation to invest in any specific investment product or service. Proper due diligence should be performed before investing in any investment vehicle. There is a risk of loss involved in all investments.


