It’s Bounce Or Else For This Key Stock Market Gauge

We’ve used much of the space here in the past several weeks pointing out the deteriorating breadth conditions in the U.S. equity market. The trend has been so profound it has now reached the point where it could potentially shift from one of short or intermediate-term relevance to something that might impact the longer-term cyclical bull market. One example of this dynamic can be seen in the differential between the NYSE New Highs and New Lows.
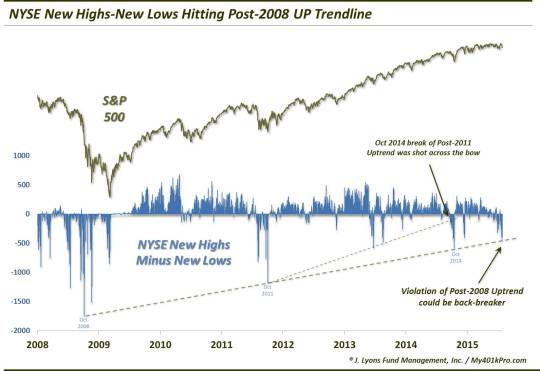
This series reached an extremely skewed -462 yesterday (18 New Highs minus 480 New Lows). If this reading gets any worse, it will be one indication that the uptrend since 2009 is in jeopardy. Here’s why:

Note how since bottoming in October 2008 at -1,751 (an all-time low, btw), NYSE New Highs-New Lows has made a series of higher lows. Those higher lows, in October 2011 at -1,175 and October 2014 at -584 line up almost precisely with one another, forming a very distinct UP trendline. That trendline is currently right in the vicinity of the -462 level reached yesterday. Is this just random? We don’t think so.
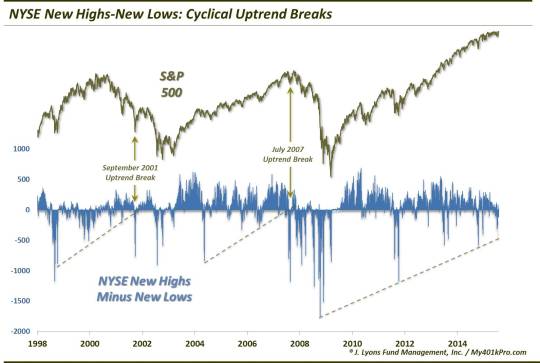
Note how in the previous two cyclical market cycles, this New High-Low series formed similar trendlines.

In September 2001 and July 2007, cyclical UP trendlines were broken. Of course, these breaks ushered in much more weakness in the stock market over the subsequent 18-20 months.
This is not to say that the long-term bull market would succumb to a straight-line decline when this UP trendline breaks. In fact, when the New High-Low uptrend is broken, it will likely be accompanied by washed-out conditions in the short-term. Therefore, a bounce of some substance may follow that reading before the meat of a cyclical bear market unfolds. This is precisely what transpired the last time we discussed this topic, in October.
In the midst of the October 2014 decline, the New High-Low series broke the shorter-term post-2011 UP trendline. This is what we had to say at the time in anticipation of the event:
It has paid and will likely continue to pay to avoid becoming too bearish from a longer, cyclical-term perspective until this uptrend line breaks. It will likely do so into a “warning shot” sell off as in 2001 and 2007. That is, it will occur into a sharp pullback that, while perhaps too late to warn of that concurrent weakness, will provide a warning that the longer-term picture has changed, for the worse.
That October trend break did indeed serve as a warning shot, in our view. For while some of the large-cap averages have made sustainable new highs since, many of the broader indexes (e.g., Value Line Composite, NYSE Composite, Russell 2000, S&P 400 Midcap), are no higher now than they were at their pre-October highs. Thus, that event served to break some of the momentum of the post-2009 cyclical bull market.
The next break, i.e., a violation of the post-2008 UP trendline in NYSE New Highs-New Lows will be an even more grave event, in our view. It will be one of the first indications that the persistence of the post-2009 cyclical bull market is in serious jeopardy. As of midday today, it looks as if the series did indeed bounce just in time. The question is for how long? We will continue to monitor this as one of the key ‘tells” relating to the survival of the cyclical bull.
_____________
“GoPro Dirt Bike” photo from this YouTube video.
More from Dana Lyons, JLFMI and My401kPro.
The commentary included in this blog is provided for informational purposes only. It does not constitute a recommendation to invest in any specific investment product or service. Proper due diligence should be performed before investing in any investment vehicle. There is a risk of loss involved in all investments.


