Key Sector Threatening Material Breakdown

We take a break from the regularly scheduled poor breadth programming to bring you a chart of a sector…that just so happens to be one of the main contributors to the poor breadth phenomenon. After threatening for months last summer to break out above its all-time high set in 2008, the basic materials sector succumbed to the October weakness along with the rest of the market. However, unlike most of the market, the sector, as represented by the Dow Jones U.S. Basic Materials Index, never did make it back to its September highs as it was caught in the deflationary spiral in commodities at the time. It did begin the year in promising fashion, though. In February, we posted that the Equal-Weight Basic Materials ETF, RTM, actually hit an all-time high, as did the Materials SPDR, XLB, despite the commodities rout. That victory was short-lived, however, and there has been precious little to cheer about in the sector since.
Earlier this month, the DJ U.S. Basic Materials Index became the first sector to actually move to a 52-week low. This was a fairly extraordinary event considering the major averages were still near their 52-week highs. The fact that the sector accounts for only 3% of the S&P 500 helps explain that possibility. However, the sector’s collapse has certainly played a role in the severe weakening of the index’s internals. And currently, the sector finds itself teetering on a very key level of potential support.
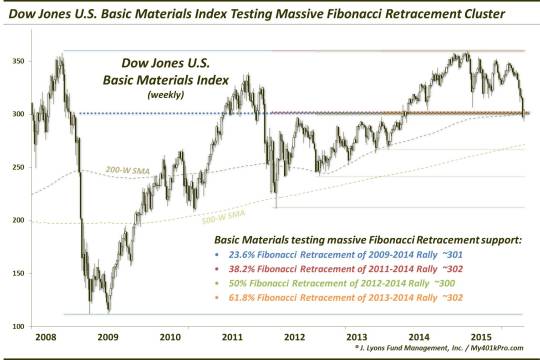
We refer quite a bit to Fibonacci Retracement levels as they reflect the market’s tendency to “retrace” market moves in similar increments. We have also mentioned before that, in our view, the strongest Fibonacci signals come when there is a confluence of various such levels in the same vicinity. No chart illustrates this point better than the DJ U.S. Basic Materials Index.

Note how the 4 Fibonacci Retracements drawn from key lows in 2009, 2011, 2012 and 2013 to the 2014 highs, are aligned almost on top of one another. In fact, it makes it difficult to distinguish each of the lines. Here are the levels to which we are referring:
- 23.6% Fibonacci Retracement of the 2009-2014 Rally ~301
- 38.2% Fibonacci Retracement of the 2011-2014 Rally ~302
- 50% Fibonacci Retracement of the 2012-2014 Rally ~300
- 61.8% Fibonacci Retracement of the 2013-2014 Rally ~302
- Additionally, the 1000-Day (or 200-Week) Simple Moving Average is right in the vicinity as well.
Again, a cluster like this increases the confidence in the validity of the level. It should support prices, at least temporarily. Also, considering this is the first touch of this major level, it should provide support , initially. Interestingly, the index blew through the level (around 300) earlier in the week before recovering it. One might consider this a false breakdown and a springboard to a significant rally. However, we’d simply view it as a test of the support level so far.
How far could the index bounce if this support holds? We are not big on setting targets, but the first level to test would certainly be near 315, which represents the breakdown point below the previous 52-week lows. That would be a 4-5% gain from here and would certainly set up a tough level of resistance for the index.
Should the Fibonacci Retracement cluster around 300 fail to hold the index up, here is the next set of Fibonacci levels that the index would be likely to test (near 266, or 11% lower):
- 38.2% Fibonacci Retracement of the 2009-2014 Rally ~265
- 50% Fibonacci Retracement of the 2011-2014 Rally ~268
- 61.8% Fibonacci Retracement of the 2012-2014 Rally ~266
- 2013 Lows ~266
- Additionally, the 500-Week Simple Moving Average is right in that vicinity as well.
One interesting observation regarding the early-year rally is that, as several readers pointed out, the falling fuel prices served as a tailwind for the chemical companies in the index as it lowered their input costs. That enabled the new highs in the Equal-Weight Index and the XLB. In the recent (or on-going) commodity slump, the basic materials sector has shown no such signs of a rally due to lower input costs. What that means, we are not sure. Perhaps the weakness in the sector’s underlying business is outweighing the benefits accrued via low energy costs. At least, that is how investors are voting.
As mentioned, considering the multiple Fibonacci lines in the area as well as this being the first touch of the area, it should hold, at least temporarily. However, if the level fails, the Dow Jones U.S. Basic Materials Index is likely to visit the next cluster of Fibonacci Retracement levels near 266. Would such a move be a byproduct of an acceleration of the global deflationary trend currently in place? Or would it be a catalyst for a broader market decline? That is yet to be determined. However, such a breakdown would not be welcomed news for a stock market that has already seen its share of bricks removed from the wall.
________
More from Dana Lyons, JLFMI and My401kPro.
The commentary included in this blog is provided for informational purposes only. It does not constitute a recommendation to invest in any specific investment product or service. Proper due diligence should be performed before investing in any investment vehicle. There is a risk of loss involved in all investments.


