Options Hedging Hitting Extreme Levels

We have been seeing signs in the past few days of elevated levels of fear on the part of traders and investors. Yesterday’s post on the 2nd 90% Down Volume Day in the past 2 weeks gave an indication of the excessive levels of selling taking place in the market. What are presumably being gobbled up in droves are put options. We see evidence of that in the CBOE Total Put/Call Ratio. We typically like to focus on the “Equity” only Put/Call ratio as it is a pure play on stock trading and sentiment. The Total Put/Call ratio may at times be skewed by options in other asset classes such as the Volatility Index (VIX). However, we have still found the “Total” Ratio to be helpful at times when it is hitting an extreme. That is the case presently as Put volume has soared relative to Call volume.
Again, Put options are bets, or hedges, that the underlying asset will drop while Calls are bets on a market rise. Therefore, when the level of Put buying soars relative to Call volume, the Put/Call Ratio rises. In most cases, when these ratios hit an extreme, they represent a solid, contrarian fade opportunity. For example, the Total Put/Call Ratio is presently at a 3-year high. That suggests that the level of Put activity is at an extreme relative to Call volume. And if historical precedents mean anything, we should be nearing a market bottom of some magnitude. Here is a chart showing the current extreme as well as similar historical extremes.
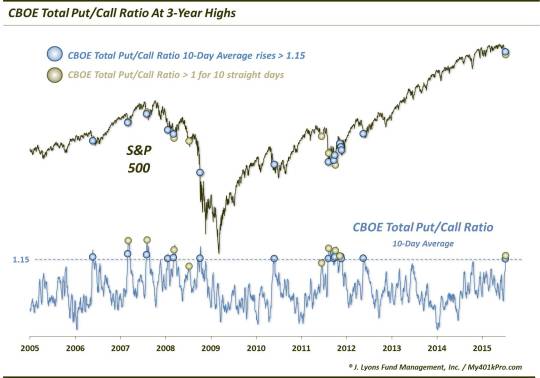
We laid out a couple different measures on the current Put/Call Ratio extreme behavior. First, using a 10-day moving average of the Ratio, we see that it has recently risen above the 1.15 level for just the 15th times in more than a decade. It is also the highest reading in over 3 years. From just eye-balling the chart, you may notice the close proximity in the timing of some of those readings to intermediate-term lows in the S&P 500. It is, therefore not surprising that these readings have led to superior intermediate-term performance by the S&P 500.
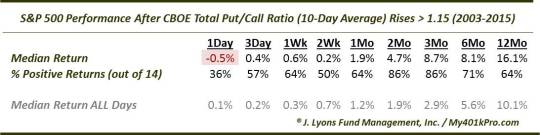
While there are only 14 precedents, the results are nonetheless encouraging for bulls. While the short-term performance has been decidedly mixed following these readings, the intermediate-term returns have been stellar. Notice the 2 to 3-month returns, especially. Not only do those periods sport 4.7% and 8.7% returns respectively, they have also been consistent performers. 12 of the 14 prior precedents showed gains over those periods.
As far as subsequent weakness following these readings, we see that the median number of days before a tradable low developed in the market was 4. And 8 of the 14 bottomed within 5 days. So, this signal looks favorable for stock bulls.
Another look at the current extreme Put activity is that the Put/Call Ratio has been above 1.0 for 10 consecutive days. That is a level of persistency that we have not seen often. In fact there have been just 8 prior instances going back 12 years (some of them obviously occurred near the same time as the other sample above). Here is the S&P 500′s performance following those streaks.
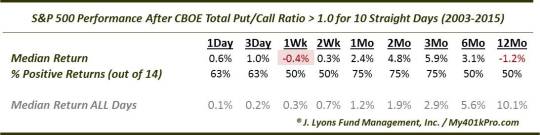
These events showed similar performance to the previous group, i.e., mixed in the short-term and robust in the intermediate-term out to 3 months. After that, things change a little, though, as median returns begin to fall. The 6-month median return is barely half of the 3-month’s. And 1 year out, the median return is actually negative. This is thanks to several occurrences in 2007-2008 as well as June 2011. And while those occurrences led to some bounce in the shorter-term, the longer-term returns show us that these signals are better used on shorter-term periods.
As with the 90% Down Day study, we are beginning to see signs of excessive fear and bearishness in the market. This includes the extremely elevated level of the CBOE Put/Call Ratio, which suggests a substantial amount of hedging taking place. Cumulatively, all these signals point to perhaps a tradable short-term or intermediate-term low in the next few days or weeks.
______
“Dark Hedges” photo by Andrew Gibson.
More from Dana Lyons, JLFMI and My401kPro.
The commentary included in this blog is provided for informational purposes only. It does not constitute a recommendation to invest in any specific investment product or service. Proper due diligence should be performed before investing in any investment vehicle. There is a risk of loss involved in all investments.


