Rare Breakout Signal May Give Bulls The Upper Hand

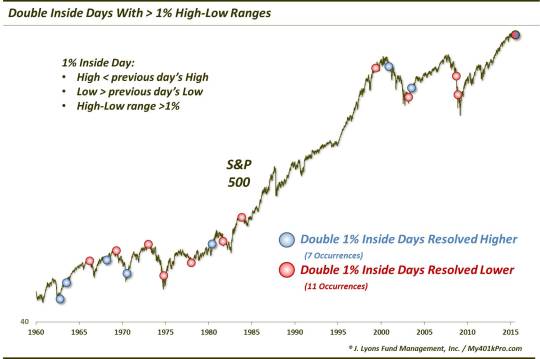
It was a wild week on Wall Street – and all the streets around the world that are home to various country stock exchanges. It is only fitting then that we close the week with an interesting and rare development from the equity market. An “inside day”, in market parlance, is one in which the day’s high is below the previous day’s high and the low is above the previous day’s low, i.e., its range is “inside” of the previous day’s. This can be a sign of market indecision as prices gradually trade in a narrower and narrower range. The implication, theoretically, is that whichever way the market breaks out of the range, i.e., up or down, can be a good indication of the forthcoming direction of prices. It doesn’t always work out that way, but historically there is evidence to back up the theory.
Occasionally, we’ll get a “double” inside day whereby 2 consecutive days qualify as inside days, resulting in 3 days of narrowing price action. The resolution of the pattern, i.e., the up or down range break, can carry even more significance than that of a normal inside day. Price action in the S&P 500 on Wednesday and Thursday of this week constituted “double inside days” as they were each within the range of the preceding day. This pattern on such a widely followed index is unusual enough. However, the real noteworthy thing about this week’s occurrence is the size of the range. Despite being the 2nd straight inside day, Thursday still had a High-Low range of greater than 1%.
Looking at the S&P 500 since 1960, we find just 18 other instances of double inside days with ranges greater than 1%.
We mentioned that there is historical evidence to back up the supposed impact of the range break on the future direction of prices. A study of the resolution of these prior double 1% inside days produces some such evidence.
For example, of the 18 prior occurrences, 7 were resolved to the upside. The breakouts were indeed an indicator of the subsequent direction of prices. Consider the statistics.
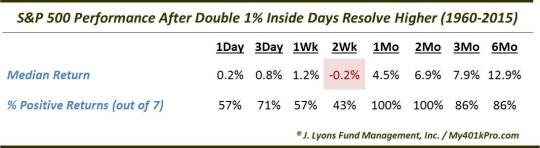
After some mixed performance in the early going, returns were quite stellar in the intermediate-term. After 1 and 2 months, all 7 of the occurrences saw the S&P 500 higher – and by a substantial amount.
Considering today’s high was above the high of the past 2 days, this should give the stock bulls some comfort. It is especially so given the historical results following double 1% inside days that were resolved lower. Here is the less-than-stellar performance following those 11 occurrences.
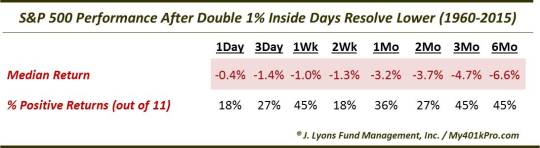
Median returns were negative following downside resolution across all time frames, from 1 day to 6 months, and significantly so. Just 2 of the 11 occurrences saw the S&P 500 higher 2 weeks afterward and just 3 were higher 2 months afterward.
It was a wild week in the stock market in which sentiment, and prices, seemed to undergo wide swings by the hour. The higher high today – and a marginal new high at that – above the double 1% inside days does not guarantee that prices will continue to rally. However, if history is any guide, this rare breakout signal appears to have ended the week on a positive note for the bulls.
________
More from Dana Lyons, JLFMI and My401kPro.
The commentary included in this blog is provided for informational purposes only. It does not constitute a recommendation to invest in any specific investment product or service. Proper due diligence should be performed before investing in any investment vehicle. There is a risk of loss involved in all investments.


