The Junkie Market: Too Many Highs And Lows?

Most market participants have probably heard of the oft-ridiculed indicator known as the “Hindenburg Omen” (HO). If you are not familiar with it, there are several factors involved in the indicator that, as you may infer by the name, supposedly holds ominous implications for the market. The main condition underlying the indicator is an excessive number of both new highs and new lows in the market. While we have not published any pieces on the HO itself, we have covered the excessive new highs/lows aspect on several occasions (most recently in December, looking at days when new highs and new lows were each >4% of total shares traded). Our conclusion was that, whatever the cause of the large number of new highs and lows, there was sufficient historical evidence to back up claims of its negative connotations.
Today, we look at another variation of this condition: days with at least 100 NYSE new highs and 100 NYSE new lows. This was inspired by yesterday’s condition of 110 new highs and 109 new lows. Yes, we are aware of the fact that there are more issues trading now than, say, 1970. Therefore, this study is essentially relevant only on a contemporary basis, since about 1995 when total issues traded on the NYSE first numbered over 3000. That figure has remained relatively steady since then, ranging between there and roughly 3500. Currently, the number of issues trading on the NYSE is around 3200.
So yes, 100 is an arbitrary number with no significance prior to the mid-1990′s. However, we have already covered high levels of new highs and lows as a percentage of total shares so you can read all about it in the December link above. And while 100 seems like a lazy, non-rigorous level, it is at least relevant over the past 20 years. Plus, the occurrences yield some interesting results – mostly not so rosy.
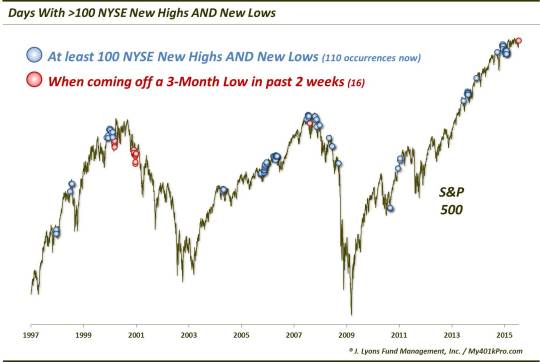
Yesterday marked the 110th day since 1995 with at least 100 NYSE new highs and 100 new lows. A quick glance at the chart may tell you that many of the occurrences came near market peaks, whether short, intermediate or long-term. Therefore, the performance of the S&P 500 was not too stellar going forward.
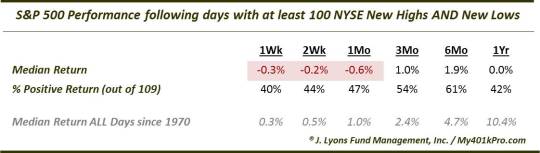
The median return following these days is historically negative out to 2 months (not shown). It does not get much better after that, however. The median return a year later is 0%.
One factor we isolated from among the sample, given the recent trading action, is the existence of a recent 3-month low. Of the 109 total prior occurrences, 15 came after the S&P 500 had formed a 3-month low some time in the past 2 weeks. Much like the picture of the junkie above, these 15 instances produced some good news and some bad news.
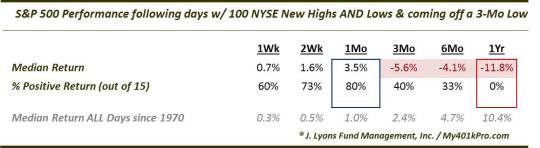
As the table shows, the near-term saw much better returns than the total sample, and even much better than all days, period. 1 month later, 12 of the 15 instances saw the S&P 500 up, and by a whopping median +3.5%. However, in the long-term, returns not only regressed toward those of the total sample, they were even worse – much worse. Yes, it is a small sample size, however 1 year after these 15 events, the S&P 500 was lower every single time, by a median -11.8%. Furthermore, it is not shown on the table, but 2 years after the events, the S&P 500 was lower every single time as well, with a median return of -30.8% and a median drawdown of -40.5%.
Yes, you read that correctly. By now, you’ve likely figured out approximately when these days occurred. Specifically, 5 occurred in March 2000, 9 in November-December 2000 and 1 in August 2007. And now, yesterday. We are not trying to sound all doomsdayish – or Hindenburgish. Whether statistically significant or not, the stats are what they are.
Why would an abundance of new highs and new lows be a negative for the stock market? We don’t have a concrete answer. Our guess is that perhaps there are a number of stocks below the surface that are breaking down – yet enough that are still performing well to mask that weakness and prevent market participants from getting too bearish. Whatever the reason, there would appear to be ample opportunities at the moment for bullish and bearish junkies alike. And while evidence suggests the bulls may be in for a high in the short-term, the longer-term may be a real downer.
__________
More from Dana Lyons, JLFMI and My401kPro.
The commentary included in this blog is provided for informational purposes only. It does not constitute a recommendation to invest in any specific investment product or service. Proper due diligence should be performed before investing in any investment vehicle. There is a risk of loss involved in all investments.


