The Summation Of All Fears

This negative breadth signal has an ominous long-term track record.
Yes, this is another post about the market’s deteriorating breadth situation. We can’t pick the market we want, though. We must deal with the one we have. And the reality is that one of the overriding themes of the current climate, in our view, is the weakening foundation of the market’s internals. By internals, or breadth, of course, we are referring to the level of positive participation among all stocks. This can be measured in many different ways, such as the number of stocks that are advancing versus declining or the number of stocks making new 52-week highs versus those making new lows. As mentioned, the breadth readings of late have been weak, even historically so by some measures. And it isn’t just a day or two here and there. Even longer-term, cumulative measures of breadth are reaching levels that, historically, have led to subpar stock performance over the longer-term.
One such cumulative measure popular among technical analysts (TA) is the McClellan Summation Index, developed by the eponymous groundbreaking TA family. Without getting too technical, the McClellan Summation Index is essentially an oscillator that reflects a running, cumulative total of advancing issues minus declining issues. There is a bit more math involved, but basically it is a measure of market breadth on a longer-term basis. It can also be applied to the number of new highs minus new lows.
Typically, but not always, the Summation Index will move in the direction of the market. At times, though, it will diverge, i.e., move in the opposite direction, from stock prices. Such a divergence can be an indication that the trend, at least in terms of breadth, is weakening. Eventually, that can have an impact on prices as well. For example, after a long uptrend in stocks, it is not uncommon to see the Summation Index begin to fade as breadth struggles to keep up with the stock averages. On occasion, the Summation Index of advances-declines or new highs-new lows will turn negative even as prices remain near their 52-week high. Even more rare is the situation wherein both the McClellan Summation Index for advances-declines as well as new highs-new lows each turn negative while stock prices remain near their highs.
That rare combination took effect as of today’s close. Specifically, each of the Summation Indexes were below 0 while the S&P 500 was within 1.5% of its 52-week high. This was just the 59th such occurrence since 1970.
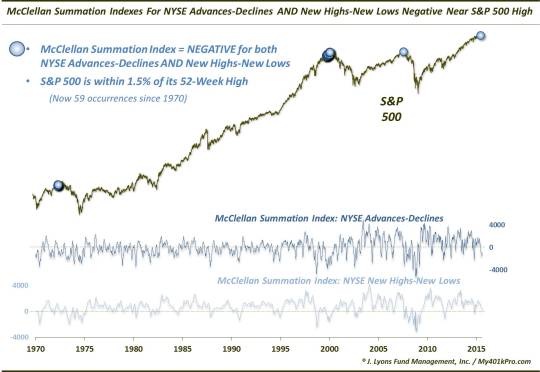
The 59 occurrences all took place in 4 distinct periods, though most of them happened within 2 clusters:
- August 1972 (13)
- November 1999-March 2000 (44)
- September 2007 (1)
- July 2015 (1)
(We also disqualified any occurrences that came immediately following a 6-month low, of which there was just 1: the end of October 2014. That came immediately following a near-10% correction in the S&P 500 that naturally took its toll on the breadth measures. The S&P 500 basically rebounded back to its former highs before breadth could recover. Thus, this reflects a slightly different situation than the other occurrences.)
Like several of the examples of poor breadth that we looked at recently, the stock market seemed to follow a similar pattern, in general, following these events, i.e., weakness in the short to intermediate-term followed by a bounce in the latter intermediate-term followed by consistently weak performance in the longer-term. As we are interpreting this development in terms of longer-term relevance, it is that longer-term performance that we are most interested in. And by a quick glance at the dates above, or the chart, it is pretty obvious that the longer-term did not work out too well for stocks following such occurrences. Here are the performance statistics following the 58 prior examples:
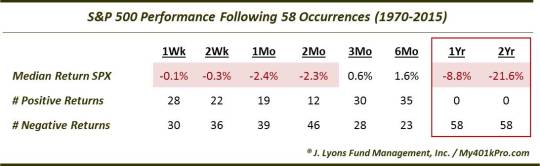
The S&P 500 was consistently weak out to 2 months. After that, more than half of the occurrences turned in gains after 3 and 6 months. Beyond that, it was a different story. Of the 58 prior occurrences, not one single time did the S&P 500 show a gain 1 year later – or even 2 years later. Given that many of the occurrences were clustered together, perhaps this is a slightly distorted way of presenting the data. Furthermore, perhaps it’s all just a coincidence. However, we are not big on coincidences. In our view, this represents a deterioration in market breadth similar to those which occurred in the lead-up to cyclical tops in 1973, 2000 and 2007.
While some may accuse us of curve-fitting, data-mining, etc., that really isn’t accurate. There is precious little optimizing going on here. We are simply taking the pulse of the current stock market climate and quantifying it for research purposes. Either way, the conclusion is the same to us. Specifically, when the McClellan Summation Index on NYSE advances-declines AND new highs-new lows registers a negative reading while the S&P 500 is within 1.5% of its 52-week high, the index has struggled mightily, and unanimously, in the longer-term. Generally, the longer-term deterioration in market breadth is an unambiguously negative factor for the stock market.
So whether you prefer to define the conditions that characterize the present market for purposes of quantitative historical research, or you’d rather subjectively ponder the general state of the market, the longer-term outlook for stocks appears to be quite ominous.
________
“Ominous” photo by Luis Argerich.
More from Dana Lyons, JLFMI and My401kPro.
The commentary included in this blog is provided for informational purposes only. It does not constitute a recommendation to invest in any specific investment product or service. Proper due diligence should be performed before investing in any investment vehicle. There is a risk of loss involved in all investments.


