“Volatile Compression” May Lead To Short-Term Stock Gain, Long-Term Pain

On Friday, we posted a chart showing a rare occurrence of 2 consecutive inside days (i.e., the range is inside of the previous day’s range) in the S&P 500
in which the high-low range was greater than 1% on each day. The theory is that a compression in prices in the form of an “inside day” is an indication of indecision. And the resolution of such compression, it is said, tends to lead to forceful moves in the direction of the resolution, or range break (i.e., up or down). It can be argued that the resolution of double inside days, in particular those with volatile and wide ranges, can lead to even more forceful moves. Indeed, we noted that, historically, there had been a distinct edge in forward returns to whichever way the range in this particular pattern was resolved. As we mentioned in the post, the high on Friday did break above Thursday’s high, albeit by a slim margin. However, it was a higher high and, at least for today, the market is following through on its historical tendency to continue to move in the direction of the range break.
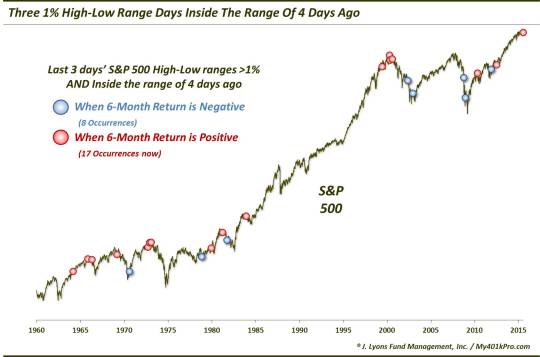
While Friday did end the streak of consecutive S&P 500 inside days, at least one “inside” pattern continued. Friday’s high was still below that of Tuesday. That meant that Wednesday, Thursday and Friday all had high-low ranges of at least 1% and were all inside the range set on Tuesday. Since 1960, that was just the 25th example of such “volatile compression” that we found.
This is an interesting development in the index and one whose historical precedents happened to occur at interesting times. First off, what was the S&P 500 performance like following such patterns? As you can imagine, the prior events all occurred among their own unique circumstances at the time. Therefore, the performance going forward was a mixed bag, as this table shows.
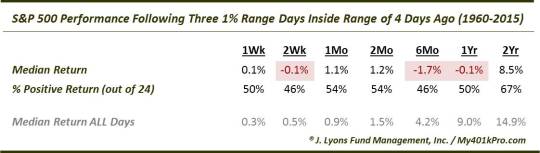
In general, the returns were weaker than normal, especially in the longer-term. However, there was a wide variance among the sample. Notice that the % of positive returns is right around 50% for every single period going out to 1 year. So what sort of variables may delineate the positive events from the negative ones?
Right off the bat, the obvious consideration is the direction in which the pattern is resolved. As we mentioned, these sorts of compression patterns tend to (though, not always) continue to move in the direction of the initial range break. And while recent years, anecdotally, seem to have brought more false breakout-type moves in stocks, historical evidence suggests that prices favor moving in the direction of the pattern resolution. Interestingly, of the prior 24 occurrences, 11 have been resolved higher and 13 lower. Strangely enough, the shorter-term price behavior leading up to the prior occurrences has had little in the way of predictive value when anticipating the range break. Consider:
- The S&P 500′s return over the 4-day pattern period was positive on 11 occasions: 5 led to pattern breakouts and 6 led to pattern breakdowns
- The S&P 500′s return over the 4-day pattern period was negative on 13 occasions: 7 led to pattern breakouts and 6 led to pattern breakdowns
Furthermore:
- The S&P 500′s return over the prior month was positive on 12 occasions: 4 led to pattern breakouts and 8 led to pattern breakdowns
- The S&P 500′s return over the prior month was negative on 12 occasions: 7 led to pattern breakouts and 5 led to pattern breakdowns
So there was a slight tendency for patterns to break down after positive 1-month performance, but mainly it has been a coin flip based on the short-term performance. In light of today’s market action, however, this has become a moot point anyway as the S&P 500 is breaking above the pattern’s highs. For the moment, this is good news for the bulls as, historically, upside breakouts have led to better returns than breakdowns, in the shorter-term.
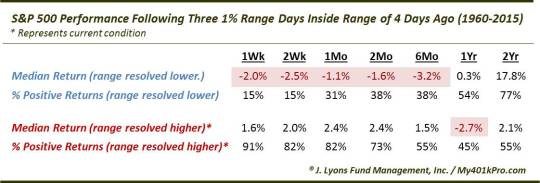
As mentioned, the advantage persisted in the direction of the range break in the intermediate-term. However, another interesting aspect of the results is that the advantage not only disappeared over the longer-term, it was reversed. The median returns following pattern breakouts actually turned negative 1 year out, and was barely positive after 2 years. And following breakdowns, returns recovered to positive by 1 year later and even above-average by 2 years out.
The reason for this is the location within the S&P 500′s cyclical pattern in many of the instances. Looking at the chart, one can see that a majority of them occurred near key cyclical inflection points, including 1965-66, 1969-70, 1972, 1978, 1981, 1983, 1999-2000, 2002, 2008 and 2011. Is this merely a coincidence? Or is this seemingly short-term pattern also indicative of indecision on a longer-term scale? We don’t know the answer but the timing of the events certainly caught our eye. It also led us to perhaps the most consistent takeaway of this particular study.
When these occurrences of three 1% days within the range of 4 days ago occurred following 6 months of gains, they tended to lead to decent short-term returns but negative longer-term returns. When they came after a 6-month decline, they saw negative median returns in the short-term but solid longer-term returns.
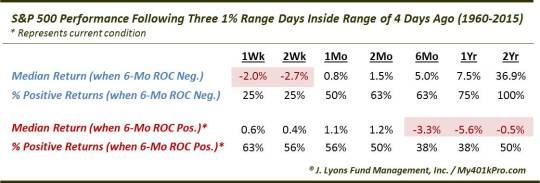
If this holds true to form in our present case, the current bounce may lead to some further upside. However, longer-term, the S&P 500 may have its work cut out for it.
Of course, this is only 1 short-term factor. It also seems to contradict Friday’s double inside day study. However, that is what market analysis involves: reconciling, or weighing, the pros and the cons. This study would seem to fall into the “con” category in the longer-term. That remains to be seen. At a minimum, we found the timing of this pattern’s occurrences to be very interesting.
________
“Vintage Light Bulb” photo by Scott Norris.
More from Dana Lyons, JLFMI and My401kPro.
The commentary included in this blog is provided for informational purposes only. It does not constitute a recommendation to invest in any specific investment product or service. Proper due diligence should be performed before investing in any investment vehicle. There is a risk of loss involved in all investments.

