Will Reversal Off 200-Day Moving Average Ignite Stocks?

Well that was quite a day. There was so much going on, from the potential “Grexit” to China’s cartoonish equity market to the meltdown in various commodities (see yesterday’s post) to the steep selloff in the U.S. equity market and its eventual total reversal, we hardly knew where to focus. On days like this it helps to have an objective and set process to help you maintain that focus where it should be. For us, we are first and foremost equity managers so that is where our focus goes on wild macro days like today. In this post, we are going to focus on certain aspects of the S&P 500′s reversal today to see if similar historical circumstances have provided the positive spark that one’s intuition may lead them to expect.
What aspects? First off, the S&P 500 touched its 200-day simple moving average for the first time in over 8 months. That alone is noteworthy. The index was also down 1.20% at its low point today, a sizable decline considering the recent low-volatility, range-bound action in the market. And of course the S&P 500′s impressive reversal higher was also noteworthy as it closed up 0.61% on the day and 1.83% above its low. Combining these variables makes for quite a noteworthy day. However, it does not lend well to historical comparisons. That is because only 3 days since 1950 meet those precise characteristics (10/28/1997, 1/16/1990 and 8/1/2007). Therefore, we loosened the parameters a little so that we might find a few more similar, if not identical, precedents. This is what we looked for:
- The S&P 500′s 1st touch of 200-Day Moving Average in 4 Months
- A Close >above the 200-Day MA
- An intraday Low that was down at least -0.5%, and…
- A Close that was higher than the Low by at least 0.5%
We found 21 days meeting that criteria, shown on this chart.
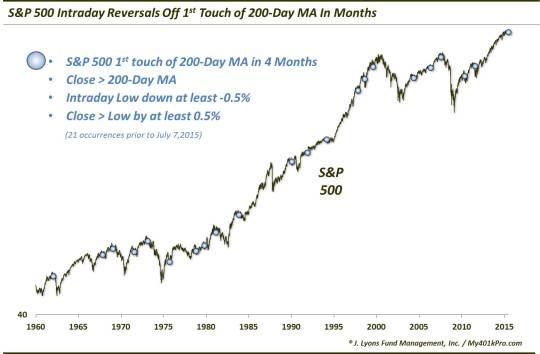
Is this combination of factors the bullish elixir that it would seem (and that most market observers in the mainstream media and social media seemed to believe today, based on my own unscientific poll)? Well, right off the bat, it is clear that there are a number of inauspicious occurrences by glancing at the chart. These include occurrences near cyclical market tops in 1962, 1969, 1973 and 2007, not to mention serious intermediate-term tops in 1981. 1983, 1990 and 2011. So we see that this signal is far from perfect in its longer-term timing. But what about in the very short-term? Let’s look at the actual performance numbers.
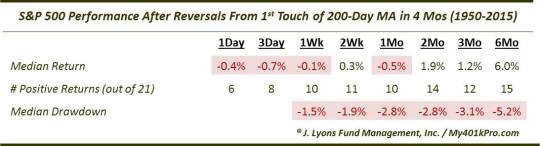
A couple things jump out at us here. First, there was very little follow-through initially, despite the seemingly significant character of the reversal. Just 6 of the 21 prior occurrence closed higher the following day, and just 8 after 3 days. And it doesn’t just appear to be merely short-term effects of post-reversal exhaustion. Because even 1 month later over half of the instances saw the S&P 500 lower and, thus, a negative median return. The 3-month median return was pretty low as well at 1.2% before finally jumping higher by 6 months out.
Perhaps even more surprising is the frequency with which these reversal days failed to mark lows over subsequent periods.
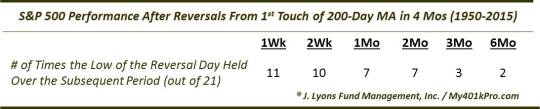
About half of the time, the low of the reversal day was taken out within a week. By 2 months, just a third of the occurrences saw the low still holding up and by 6 months later, just 3 of the events’ lows had not been broken.
What is our takeaway? Most of all, it is that investors and traders should be cautious in assuming that seemingly obvious bullish scenarios are actually what they seem to be (the same goes for “obvious” bearish scenarios). The stock market is not in the business of granting easy money based on intuition. In fact, what transpires in the market is more often counter-intuitive. And so it is with reversals similar to what we witnessed today, occurring upon the first touch of the 200-day moving average in several months. No, it is not necessarily a sell signal. However, if history is any guide, don’t be surprised to see some backing and filling over the next few weeks to months, including a potential new low in the S&P 500 before it’s all said and done.
Of course, if the V-Bottom has awoken from hibernation, it may be a different story…
___________________
Photo from Kawarau Bungy of New Zealand.
More from Dana Lyons, JLFMI and My401kPro.
The commentary included in this blog is provided for informational purposes only. It does not constitute a recommendation to invest in any specific investment product or service. Proper due diligence should be performed before investing in any investment vehicle. There is a risk of loss involved in all investments.


