Equity Options Traders Head For The Hills

The ISE Equity Call/Put Ratio has been under 100 for a record 3 consecutive days.
As we have mentioned frequently, the task of weighing positive versus negative inputs is a constant challenge for a money manager. Often, the reconciliation comes via duration differences. For example, the intermediate-term data may line up bearishly for equities while the short-term looks attractive. That may be a reasonable description of the current market. We have spent the better part of the past month detailing the deteriorating breadth situation. That development is primarily of an intermediate-term concern. And while that is the primary duration of focus for our management business, it doesn’t mean that we don’t consider conflicting inputs of other durations. And the options market is currently flashing one potentially positive short-term data point.
We’ve covered the International Securities Exchange Equity Call/Put Ratio (ISEE) on several occasions over the past year, most recently on January 22 (at least in a bullish light). As we wrote in that post:
Due to its unique construction, the ISEE has become a favorite indicator of ours for highlighting short-term inflection points in investor sentiment. The ISEE excludes firm trades that are quite likely to be hedges and also excludes volume on closing positions when calculating the Call/Put ratio. Therefore, the ISE argues that its ratio is a more pure indication of investor sentiment than some of the other options ratios. If this is indeed the case, we may be near a short-term extreme in “fear”.
The 100 level in the ISEE has historically often been a signal that options traders are becoming fearful (100 means equal call and put volume). Dips below that level have on several occasions come near short to intermediate-term lows in the market as traders have either stormed into puts and/or have shied away from buying call options. The ratio has been below that 100 level for each of the past 2 days.
We can reiterate the exact same thing today – except that the ISEE has now closed below 100 for 3 consecutive days. 2 straight days below 100 has been rare as it has occurred just 8 times now since the inception of the ISEE data in 2006. This is just the 3rd time that the streak extended to 3 days. It has never gone on to 4.
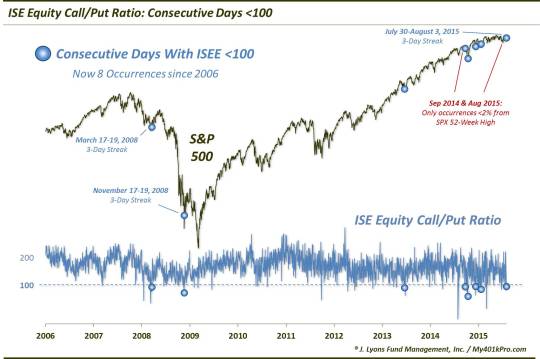
These are the dates of all 8 occurrences:
- March 17-19, 2008 (3 days)
- November 17-19, 2008 (3 days)
- June 20-21, 2013
- September 22-23, 2014
- October 13-14, 2014
- December 11-12, 2014
- January 20-21, 2015
- July 30-August 3, 2015 (3 days)
You may recognize some of the dates right off the bat as short to intermediate-term lows. Indeed, the general pattern has been that, after a few volatile days, the S&P 500 consistently out-performs over the next few weeks to months. Here are the statistics:
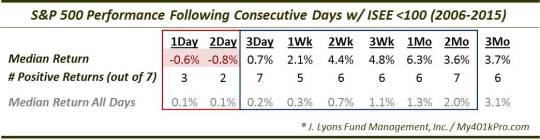
As the table shows, just 2 of the prior 7 occurrences showed gains in the S&P 500 2 days after the streak ended (that would be tomorrow, August 5, assuming the ISEE does not register <100 again today). Amazingly, by the following day, all 7 were positive. And it was all uphill after that as well, at least in the short-term. 6 of the 7 were positive from 2 weeks to 1 month out, when the median return peaked at a whopping +6.3%. 2 months out, all 7 were positive, though the median return began dropping towards that typical of all days. So it’s full speed ahead, right? Not so fast…
The setup surrounding the current version of this streak is somewhat atypical compared to the others. And its atypicality somewhat aligns it with the one instance that showed a negative return from 2 weeks to 1 month out, namely September 22-23 of last year. Of course, that occurrence led immediately to the near-10% selloff into mid-October. Why is it atypical?
- At -1.54%, it is the only one besides last September (-1.42%) that occurred less than 2.8% from the S&P 500′s 52-week high.
- At -0.07%, it is the only one besides last September (-0.97%) that occurred while the S&P 500′s 3-week return was better than -2.35%.
- At roughly 12-13, it is the only one besides last September (13-14) to occur while the S&P 500 Volatility Index (VIX) was trading at less than an 18-handle.
What this all spells out is that our present circumstances do not necessarily paint the picture of short-term “fear” that has accompanied most of the other occurrences. It does not guarantee that the stock market will follow in the footsteps of last September and continue to drop for the next few weeks. However, in our view, it does somewhat temper the confidence in an imminent, fear-driven short-term bounce. On the plus side, last September was one of the few that saw a bounce the day after the streak ended, so perhaps there is hope for the rest of today.
And so the challenge of balancing the positives and negatives goes on…
________
Photo by Keith Alexander.
More from Dana Lyons, JLFMI and My401kPro.
The commentary included in this blog is provided for informational purposes only. It does not constitute a recommendation to invest in any specific investment product or service. Proper due diligence should be performed before investing in any investment vehicle. There is a risk of loss involved in all investments.


