Stock Options Hedging Reaches 6-Year High

We posted a chart a week ago on the recent high level of equity put option volume relative to call volume on the International Securities Exchange. At the time, the ISEE Call/Put Ratio had been under 100 (more accurately, 1.00) for 3 days running, tying it for the longest streak since the series’ inception in 2006. The past 2 days have also registered readings below 100, making it 5 out of 7 days. That surpassed the previous high of 3 set in March 2008. As it turns out, the ISE is not the only exchange seeing a relatively large amount of put volume. In recent days, the CBOE equity Put/Call Ratio (note the CBOE uses “Puts” as the numerator rather than the denominator) has generated several elevated readings, by historical standards.
Combining the options ratios from both exchanges can provide us with a broad, if not comprehensive, look at the state of the stock options market. An easy way to do this is to simply divide the CBOE ratio by the ISEE ratio. The higher the resultant number, the higher the relative degree of put volume versus call volume across the exchanges. The figure generated by this combined ratio on Friday was 1.25 (.83/.66). As it turns out, this was just the 14th time the ratio has been above 1.00 since the inception of the ISEE in 2006. It is also the 2nd highest reading since 2008, behind August 1, 2014. Smoothing out the ratio by using a 21-day moving average, the ratio is at the highest level since September 2009.
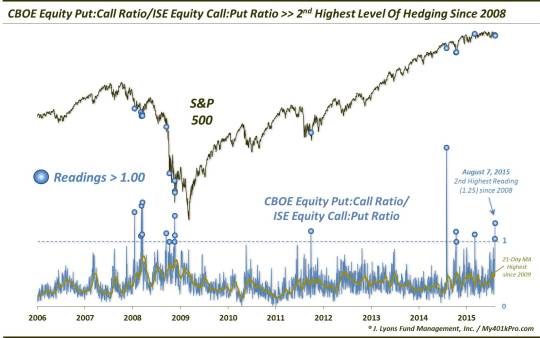
As the chart illustrates, most of the previous readings over 1.00 occurred near the lows following intermediate-term declines, including events in January, March and November 2008, September 2011 and August and October 2014. Naturally, the short to intermediate-term returns in the S&P 500 were exceedingly positive.
There were a few false positives, however. September 15, 2008, for example, after which the market decline entered into its waterfall-type descent. Additionally, on March 5 of this year. That was an interesting reading as it A) occurred with the S&P 500 only a few percentage points off of its high and B) substantially as a result of a low ISEE reading as opposed to a high CBOE reading. This combination is not too dissimilar from our current situation. The S&P 500 is within a few percentage points of its all-time high. Furthermore, while elevated, the CBOE Put/Call ratio was not overly extreme on Friday. The ISEE number on the other hand was tied for the 3rd lowest reading in the series history. And as the CBOE statistics have a longer track record and more volume, we would argue there is some degree of mitigation in terms of the current signal’s bullish ramifications.
Thus, the present occurrence should probably be taken with a grain of salt – whether it’s a fine or coarse grain is the question. Regardless of the sodium issue, the reading is certainly a bullish data point from a contrarian view. How much juice has been removed already as a result of today’s rally is another question…
______
“Dark Hedges” photo by Andrew Gibson.
More from Dana Lyons, JLFMI and My401kPro.
The commentary included in this blog is provided for informational purposes only. It does not constitute a recommendation to invest in any specific investment product or service. Proper due diligence should be performed before investing in any investment vehicle. There is a risk of loss involved in all investments.


