Flurry Of 90% Down Days: Capitulation Or Caution?

Three 90% Down Days in 2 weeks may signal brighter longer-term prospects…but not without heightened risk in the near-term.
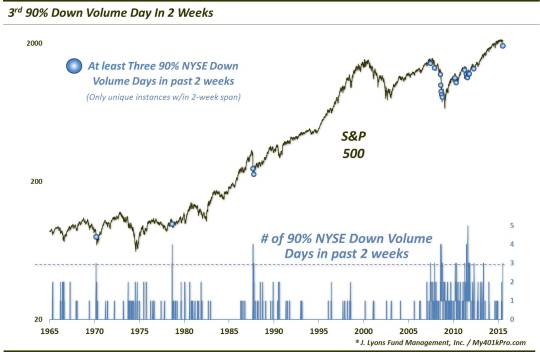
One theme coming out of our posts this week concerning the recent volatility (yes, that means down AND up) has been…expect more volatility. Today’s post fits right in with that theme. We have written several posts regarding “90% Down Volume Days”, i.e., days in which 90% of the volume on an exchange occurred in declining stocks. Often, these days mark at least a short-term selling climax as market participants all race for the exits at once. Thus, the future returns following such days are skewed quite positively.
This is particularly true after seeing multiple 90% Down Days in a short period of time, as we last looked at on July 9 (as long as it wasn’t coming right off of a 52-week high). Well, today’s Chart Of The Day takes it one step further as yesterday saw the 3rd 90% Down Volume Day on the NYSE in the past 2 weeks. This is the 22nd such instance that we have identified going back to 1965 (unique instances, not clusters).
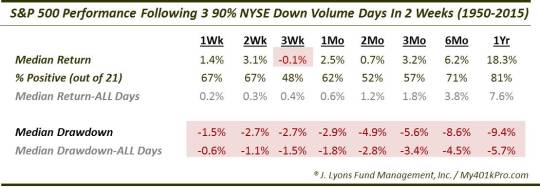
So if 2 90% Down Volume Days in 2 weeks produces good forward returns, then 3 must bring even better returns, right? Not so fast. Although the median returns following 3 90% Down Volume Days are better than typical returns over most time frames, they actually lag significantly those following just 2 90% Down Days.
Furthermore, the median drawdown (or, max loss) in the near-term is fairly elevated, even out to 3 months, despite the solid returns. This suggests that, while the longer-term time frame may offer attractive returns, the short-term may very well continue to be laden with risk.
Why are these returns worse than those following just 2 90% Down Volume Days? We don’t know. But the presence of 3 such days in a 2-week span may be a suggestion that the market is not just experiencing short-term capitulation but may actually be entering into a new, less-healthy market climate.
Indeed, that is what we saw beginning with one of these signals in August 2007. The market would continue to see a series of these occurrences all the way down to the lows in 2009. While some of these occurred near short-term lows, the longer-term returns obviously suffered during that period, dampening the figures in the table above.
So what is our takeaway? Perhaps it’s that you can have too much of a good thing. While the occurrence of 2 90% Down Volume Days in a 2-week span has often been a marker of a nearby low, the presence of an additional one has not aided that tendency. On the contrary, it has led to lackluster returns out to 2 months and has generally been an indicator of heightened short-term risk.
Again, not to make predictions or anchor our outlook, but this is another piece of evidence suggesting a potential retest of the lows, or at least continued short-term volatility before any substantive bounce unfolds.
_______
“Exit sign” photo by Dean Terry.
More from Dana Lyons, JLFMI and My401kPro.
The commentary included in this blog is provided for informational purposes only. It does not constitute a recommendation to invest in any specific investment product or service. Proper due diligence should be performed before investing in any investment vehicle. There is a risk of loss involved in all investments.


