“(Not Always) Smart Money” Hedgers Are Record Long S&P 500 Futures

It seems like sentiment indicators used to be more straightforward. That is, when one group of traders or survey respondents were positioned to an extreme, either bullish or bearish, a reversion in prices seemed to be on tap. Some of these indicators have gotten a bit more complicated in recent years, however. One such example comes from the Commitment Of Traders report on S&P 500 futures out of the CFTC.
To refresh, the CFTC tracks the net positioning of various groups of traders in the futures market in the COT report. One such group is the Commercial Hedgers. As their name implies, their main function in the futures market is to hedge. By definition, therefore, they typically build up positions contrary to the prevailing trend. As a result, this group is typically correctly positioned (and extremely so) at major turning points in a market. It is for that reason that the group is usually referred to as the “smart money”. However, that is not always the case. Consider the case of the Commercial Hedgers’ position in the S&P 500 futures.
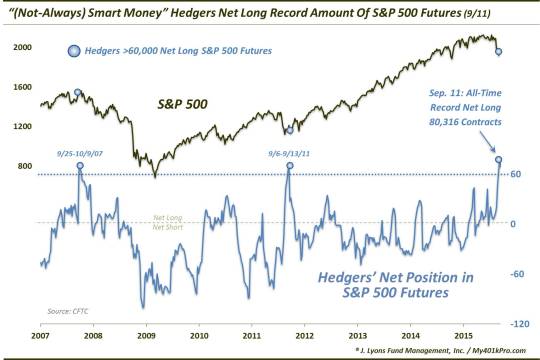
As of the September 11, 2015 COT report, Hedgers were holding an all-time record net long 80,316 S&P 500 futures contracts, as shown in our Chart Of The Day.
So naturally, the tendency is consider this an overwhelmingly bullish signal. However, when we look at other similar extremes, it’s not at all straightforward.
There have been 2 other occasions in which Hedgers were net long more than 60,000 S&P 500 contracts. The last time was September 6-13, 2011. Interestingly, that period bore significant resemblance to the current market in that the market was trying to stabilize itself following an August mini-crash. The S&P 500 would continue to swing wildly for another few weeks before embarking on substantial rally. Thus, despite a short-term hiccup or two, the large bullish position eventually paid off in spades for the Commercial Hedgers.
On the other hand…
The only other time the s&P 500 Hedgers’ net long position exceeded 60,000 contracts was…September 25-October 9, 2007. I may or may not have to remind you that October 9, 2007 marked the all-time high in the S&P 500 to that point – and for 6 years to follow. Obviously, this was decidedly NOT a well-timed long extreme.
So what is the deal here with what is supposed to be a reliable non-contrarian sentiment signal? The reality is we don’t know and likely nobody knows. Some of these metrics have become so complicated, it is hard to keep them straight. This is especially true with some of the COT reports. There are now so many derivative products based off of these futures, and derivatives OF THOSE derivatives that it is impossible to keep track of all of the cross-currents. Thus, it is impossible to know for sure if the smart money really is long or short – and therefore, if they really are the smart money.
I suppose the important takeaway here is to always do your homework when it comes to sentiment indicators and who is supposed to be the so-called “smart money”. Don’t merely take it for gospel when told who such groups of investors are.
And even then, know that sometimes smart money does dumb things.
______
More from Dana Lyons, JLFMI and My401kPro.
The commentary included in this blog is provided for informational purposes only. It does not constitute a recommendation to invest in any specific investment product or service. Proper due diligence should be performed before investing in any investment vehicle. There is a risk of loss involved in all investments.


