Odds Favor A Year-End Rally…After A New Low

August 6-month lows have had a tendency to be broken in the coming months, prior to a year-end bounce.
After getting kicked in the teeth in August, the stock market is starting out September by getting stomped on the head. Following the historic rebound to end last week, investors were hoping that the worst was behind them. As we noted regarding such rebounds yesterday, however, perhaps we should not be surprised by renewed weakness. And adding further evidence to support the “retest” scenario versus the “V-bottom” scenario, today’s post looks at 6-month lows in the S&P 500 occurring in August and the resultant performance through the end of the year.
Going back to 1950, this is the 13th year in which the S&P 500 has reached a 6-month low (on an intraday-basis), the most of any month besides July and October. Here are the 13 years:
- 1953
- 1966
- 1971
- 1973
- 1974
- 1977
- 1981
- 1982
- 1990
- 1998
- 2004
- 2011
- 2015
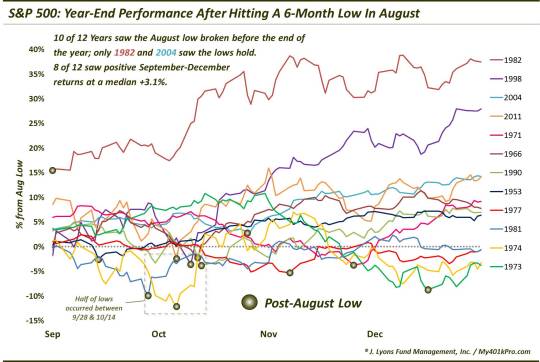
How did the S&P 500 react to these August lows? Here is a chart showing the performance of the index from September 1 through year-end in each of the years listed above (FYI, the chart indicates performance based on the % above or below the August low).

First of all, apologies for the busy chart. Second of all, are there any patterns consistent enough to take into consideration when navigating the next 4 months? Well, that’s up to you, but there are a few notable tendencies among the sample of 12 prior instances.
- 10 of the 12 years saw the S&P 500 drop below the August at some point before the end of the year.
- Only 1982 and 2004 saw the S&P 500 hold above the August low through year-end.
- The median low-point among the entire sample was -3.7% below the August lows.
- 6 of the prior 12 years saw the S&P 500 bottom out between September 28 and October 14.
- 8 of the 12 saw a positive return from September 1 (not from the August low) through year-end with a median return among the entire sample of +3.1%
The fact that the S&P 500 began the month of September 5.6% above the August lows certainly gives it a bit of a cushion. In fact, it is the 4th largest margin above the August lows of the entire sample group. However, it would not be unprecedented to see the S&P 500 fail to hold its August lows. Two of the years that began September further above the August lows – 1971 and 2011 –did see those lows eventually taken out.
Seasonality is always a difficult concept to embrace in investing, especially when its suggestions run contrary to other prevailing analysis. Furthermore, its patterns need to be followed religiously every year to reap the rewards. Even then, sometimes it is years before a seasonal pattern pays dividends to an adherent. However, the more we look at such seasonal factors, the more evidence we see that there does seem to be statistical merit to it as an analytical tool.
In this case, 6 month lows in August have had a tendency to be broken at some point before year-end, for whatever reason. The good news is that subsequent to a new low, the S&P 500 has shown the tendency to rally into year-end, even closing above its September opening price the majority of the time. This path generally traces out the cliched summer selloff/October retest/year-end bounce pattern that has unfolded so many times throughout history.
Will that be the S&P 500′s path this year? Can such a well-known seasonal bottoming pattern really unfold? That remains to be seen, but the market is setting up for such a possibility. Perhaps the most important takeaway, however, is that we should not be shocked to see the August lows taken out in the next few weeks or months.
________
A sudden dip in the road photo from dudelol.com.
More from Dana Lyons, JLFMI and My401kPro.
The commentary included in this blog is provided for informational purposes only. It does not constitute a recommendation to invest in any specific investment product or service. Proper due diligence should be performed before investing in any investment vehicle. There is a risk of loss involved in all investments.


