The Most Loved Stock Market Rally In History

One survey recently recorded the highest level of expectations for a market rally in its (admittedly brief) history.
Not too long ago, stock market bulls were fond of dubbing this cyclical rally “the most hated bull market in history”. The premise was that, despite the considerable gains accrued by the market since the 2009 lows, investors were relatively slow to embrace the rally. We would say that based on various money flow and sentiment metrics, there was probably some truth to that notion, up until perhaps mid-2013. Since then, we have seen a notable pickup in investors’ collective “embrace” of stocks. In fact, according to the University of Michigan’s Survey of Consumers, respondents’ expectations for a stock market rally have never been higher than they were in June. That should be a red flag from a contrarian sentiment basis.
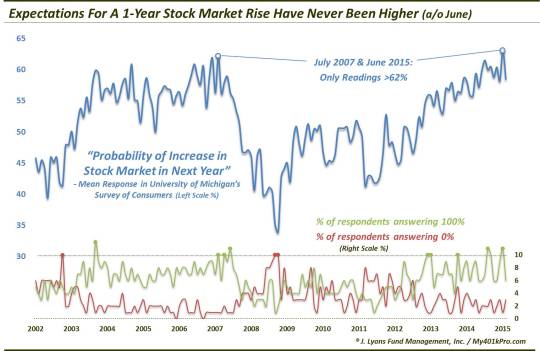
As shown in the chart, the UM survey asks people for their “probability of an increase in the stock market in the next year”. Taking the mean response to that question, June’s reading of 63.1 is the highest ever recorded in their survey, surpassing the previous record of 62.2 from July 2007. So much for the most hated rally in history.
Okay, okay, so the data series has only been around since 2002, giving us just 2 cyclical bull markets in which to judge. We fully acknowledge that and acknowledge the unqualified hyperbole of this post’s title. Let that be a preemptive admission for the flood of feedback waiting to point that out. However, technically, the title is accurate.
Another interesting view of the survey comes from a look at the extreme responses rather than the mean. When tallying the survey results, the UM breaks the responses down by quartiles (i.e., the % of respondents expressing a probability between 1%-24%, 25%-49%, etc.). They also provide the percentage of respondents who say there is a 0% chance of a stock market rally over the following year as well as the percentage of respondents saying there is a 100% chance. Not surprisingly, a high level of these respective responses have come at interesting junctures, i.e., the wrong junctures.
Here are the months in which at least 10% of respondents said there was a 0% chance of a market rally over the next year:
- March 2003 (10%)
-
February 2009 (10%)
-
March 2009 (10%)
Obviously, those are the dates of the previous two cyclical market bottoms.
Here are the months in which at least 10% of respondents said there was
a 100% chance of a market rally over the next year:
- February 2004 (12%)
- July 2007 (10%)
- September 2007 (10%)
- November 2007 (11%)
- May 2013 (10%)
- June 2013 (10%)
- March 2014 (10%)
- January 2015 (11%)
-
February 2015 (10%)
- June 2015 (11%)
The dates in 2007 obviously occurred as the market was putting in a cyclical top. The rest of the months did occur during bull markets, so that gives hope in light of the recent reading that the rally can continue. However, even after those intra-bull market readings, stocks did struggle in the months following.
That even includes the bevy of readings occurring over the past few years, despite the strong general rally. And while these respondents may represent a relatively few bullish die-hards, the readings do lend more evidence against the “most hated bull market” argument.
Speaking of struggling in the months following, we have obviously seen that again since the June spike in “100% respondents”. Given the recent crash-like action in the stock market, that short-term tendency to struggle following such readings has been satisfied. But what about the longer-term?
We don’t have the reading for August so we don’t know how much of the excess has been wrung out of this survey. However, as the buildup in this sentiment series has taken years to accomplish, it is unlikely that a full correction of the excess can take place in 1, albeit historically volatile, down month. If indeed a cyclical top in stocks has been formed, or is in the process of forming, this data series will likely require either a greater crash or, more likely, much more time to fully correct its bullish excess. We would not be surprised if such a scenario unfolded.
If that’s the case, you’ll really see what a hated market looks like.
______
More from Dana Lyons, JLFMI and My401kPro.
The commentary included in this blog is provided for informational purposes only. It does not constitute a recommendation to invest in any specific investment product or service. Proper due diligence should be performed before investing in any investment vehicle. There is a risk of loss involved in all investments.


