What Does Last Week’s Record Bounce Mean For Stocks?

Last week was certainly a historic one in the markets. Given Monday’s mini-crash, somewhat lost in it all (except for the bulls) was the fact that, by Friday, some of the indices had actually recovered their entire losses from the beginning of the week. The Dow Jones Industrial Average (DJIA), for one, experienced its biggest point recovery ever, finishing higher on the week by over 1%. The attention that the impressive bounce did receive was certainly substantially slanted toward a bullish interpretation. That’s understandable – the market erases a huge loss with a monster rally to end the week positive. Nothing wrong with that. It certainly looks nice on a chart. But how meaningful is it really going forward?
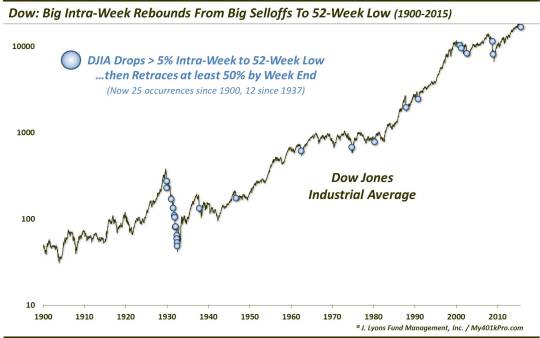
We took a look at the DJIA from 1900-2015 to find any similar rebounds from steep intra-week selloffs. Setting the criteria for such a study is certainly purely subjective. However, this is what we settled on:
- An intra-week decline of at least 5%
- At least an intra-day touch of a 52-week low
- A rebound that retraces at least 50% of the decline by the end of the week
Using that criteria, we found 24 such weeks since 1900, prior to last week.
One might think that requiring just a 50% retracement of the DJIA’s intra-week decline may be setting the criteria too loose. After all, the DJIA did retrace more than 100% of its decline. However, we wanted to give a little leeway so as not to data-mine too closely. Furthermore, requiring a 100% retracement yielded just 10 prior instances, and just 2 since 1932. That is a very small sample size over 115 years (as it turns out, the forward performance for rallies that retraced 50% versus 100% of the declines were not materially different anyway). On top of that, not all rallies began early enough in the week to allow for a full retracement. In short, we wanted to be more inclusive in an effort to capture the “spirit” of the specific setup.
So how did the DJIA do following these impressive rebounds? Not too impressively, I’m afraid. Here are the DJIA’s median returns following such “bounce weeks”:
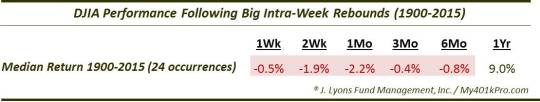
The median return was negative all the way out to 6 months, though not by much. It definitely has not been the bullish harbinger that many are hoping for.
One asterisk to those returns, however, is that a significant culprit contributing to the poor performance was the cyclical bear market immediately following the 1929 crash. No fewer than half of the 24 prior events occurred during the 1292-1932 bear market. As it was essentially a straight shot down, returns after those events were horrendous.
Separating the returns through the occurrence in 1937 and afterward, we find a definitive split in the performance of the DJIA following big weekly rebounds.
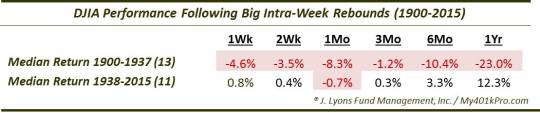
Even so, the great divide between the two periods is still more of a function of the extremely poor returns in the 1930′s. The returns since then are nothing to write home about. They are, in fact, below average out to 3 months and barely average across the longer time frames out to 1 year. So based on that, we cannot conclude that this huge weekly rebound has much more impact beyond last Friday.
In terms of marking major market lows, this pattern does not have a good track record. There were a few that occurred in the lead up to a major low, but not without at least a retest and lower lows first. In fact, of the 24 prior occurrences, just 4 were able to avoid any lower closes for the next 2 months. And lest you get too bullish about those prospects, consider the dates of those 4 instances: 11/15/1929, 10/20/2000, 3/23/2001 and 11/21/2008. Each of those events saw the DJIA go on to make significantly lower lows.
One other note of interest concerning the current instance is that it occurred with the DJIA just 9.16% off of its 52-week high. The average distance below the DJIA’s 52-week high among the other 24 occurrences was 36%. Even those occurring since the 1930′s averaged 20% below the DJIA’s 52-week high. The 2 events occurring with the DJIA closest to its 52-week high, before this one, were the 2000 and 2001 occurrences, at 12% away.
What this means, we can’t be sure. It could mean there is more risk given the DJIA’s relatively elevated level. Or it could mean that the DJIA is in stronger technical position, having held up better than previous instances.
Whatever the message is to these mega intra-week rebounds (if there is one), I’m afraid it just hasn’t been the “out of the woods” bullish sign that many were hoping it was.
________
Trampoline photo by Bobertson.
More from Dana Lyons, JLFMI and My401kPro.
The commentary included in this blog is provided for informational purposes only. It does not constitute a recommendation to invest in any specific investment product or service. Proper due diligence should be performed before investing in any investment vehicle. There is a risk of loss involved in all investments.


