What Happens After A Crash?

Our posts this week have dealt with analyzing the aftermath of the recent historic events that have unfolded in the stock market. However, of all the worthy topics that we have addressed, we have not directly addressed the most important one: the “post-crash” environment. Seeing as though the dramatic market decline in the latter half of August was the tremor from which all other price action has resulted, it stands to reason that we take a good look at it directly. In other words, how has the market historically behaved following similar “crashes”.
We put quotation marks around the word crash as the term is obviously open for interpretation. Certainly anyone who experienced the October 1987 events would be hard pressed to call anything since then a “crash”. However, for the sake of this study we are going to call the recent decline, and any similar such historical selloff, a “crash”. Specifically, we looked at all times in the S&P 500 since 1950 in which the index dropped at least 10% within 10 days (credit to fellow advisor and friend, Paul Schatz [@Paul_Schatz on Twitter] for the concept).
As it turns out, we identified 11 prior unique crash occurrences. By unique, I mean we eliminated any successive crashes and any crashes that were within the confines of a retest of a prior crash. Among the 11, 2 of them – July 1974 and September 2008 – continued to cascade lower, nearly unabated, for several more months. The other 9 resulted in an initial low in relatively short order. By initial low, we mean the first step within a market bottoming process. Those 9 are the subject of today’s Chart Of The Day, and this post. These are the months containing the 9 dates:
- May 1962
- May 1970
- October 1987
- August 1998
- April 2000
- March 2001
- September 2001
- July 2002
- August 2011
We are using these 9 as comparisons under the assumption that the August 25 low was an initial low of a bottoming process. While that is open for debate, considering the price action since then, most noteworthy of which is the fact that the low has not been breached, August 25 certainly fits the possible bill as an initial low.
So what can we learn from these 9 prior occurrences? Here is a chart tracking each of the events from the day of their initial low until the final day of the bottoming process (the bottoming process was determined to be complete if it led to a rally of at least several months).
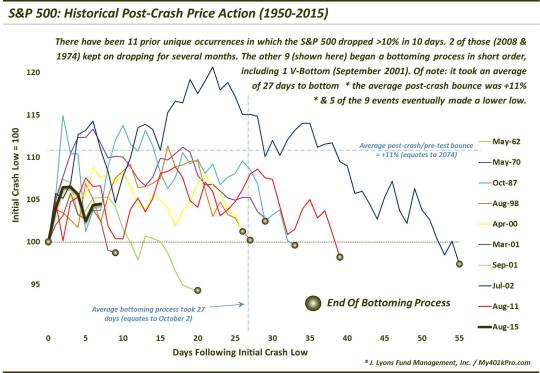
It is another busy chart, but what sort of instruction can we take from it? Here are a few items of note:
- Of the 9, there was just 1 “V-Bottom” – September 2001 – that was never subject to a retest.
- The other 8 all went on to test the initial low at some point.
- 5 of the 9 eventually dropped below the initial low, if only marginally.
- The quickest retest/bottom process came after the March 2001 decline and lasted just 9 days.
- The longest bottoming process – following the July 2002 crash – lasted 55 days.
- The average bottoming process lasted 27 days (which would equate to October 2 in our present situation).
- The average bounce between the initial low and the end of the bottoming process was +11%. That would equate to 2074 in our current circumstances.
- The majority of the crashes (5) came after significant damage had already been done, i.e., the S&P 500 was anywhere from -7% to -25% below its 52-week high when the crash began.
- The other 4 (1987, 1998, 2000 and 2011) began from within 2.6% of the S&P 500′s 52-week high. The recent crash started at just -1.25% below the 52-week high.
It is not our intent to “predict” the path of prices of the ongoing post-crash period based on these historical comparisons. There is no guarantee that the market will follow any of these precedents, either individually or collectively. Who knows – prices could soar from here without any sort of retest…or they could cascade lower ala 2008.
All we are trying to do is improve our odds of making sound investment decisions. In the pursuit of that, we have attempted to identify structurally similar “post-crash” periods for examination.
This examination would loosely suggest that the current bottoming process (assuming we are in one) may possibly persist for another month, with a possible higher bounce along the way before a possible retest of the August 25 lows.
_______
More from Dana Lyons, JLFMI and My401kPro.
The commentary included in this blog is provided for informational purposes only. It does not constitute a recommendation to invest in any specific investment product or service. Proper due diligence should be performed before investing in any investment vehicle. There is a risk of loss involved in all investments.


