Is The Small-Cap Under-Performance A Big Deal?

After the initial pop off the September low, small-cap stocks have significantly under-performed their larger peers – is that trend as troublesome as some are claiming?
If you are closely involved with markets, you know that there are always items of concern among participants. One such concern presently is the recent under-performance on the part of small-cap stocks. In the initial ramp off of the late-September lows, small-caps performed in line or better than larger cap stocks. However, since that first week or so of the surge, smaller stocks have lagged, even as large-caps have continued to score higher highs. This has some observers worried about the “quality” of the current rally. Are those concerns warranted? We took a closer look at the situation to see if we couldn’t find a few clues.
First off, what sort of under-performance are we talking about on the part of small-caps? Well, the first pop off of the September “re-test” lows lasted about 7 days, rallying all of the indices by about 6-8%. In the roughly 2 weeks since, however, there has been quite a bifurcation in the performance of the various indices. The S&P 500 large-cap index, for example, has continued to advance, rallying nearly 3% over that time. Meanwhile, the Russell 2000 small-cap index is essentially unchanged. That dynamic has some folks worried that the rally may have run its course. Let’s check it out.
Since 1991, we have found 75 previous days in which the S&P 500 showed a 2-week gain of at least 2% while the Russell 2000 gained no better than 0.5%. We took those results and drilled down further, looking for instances that in some way matched our present circumstances. We zeroed in on 2 sets of circumstances to see if there was anything consistent in the market performance following such events.
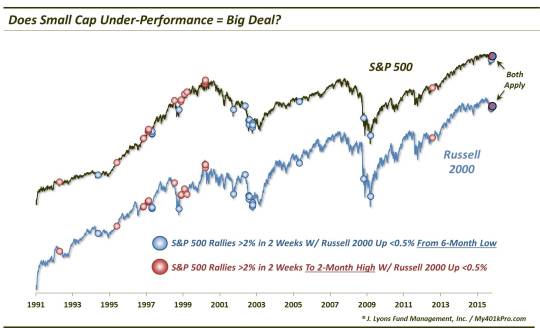
As the chart shows, one of the factors we looked for were times, like now, when stocks were coming off of a 6-month low some time over the past month, at least in the Russell 2000. We found 20 such prior events (shown as blue dots on the chart). So did the Russell 2000 put a halt to the bounce? Not in the slightest.
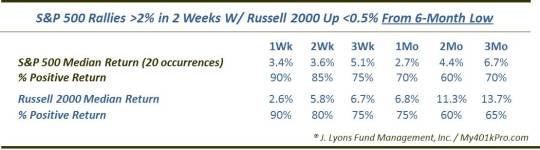
Both the S&P 500 and the Russell 2000 consistently rallied in the subsequent week to 6 months. The 1-week marker was especially consistent as 18 of the 20 events showed a positive return in the of the indices. In terms of return, both indices showed stellar figures, peaking at the 3-month mark at a median +6.7% and +13.7% for the S&P 500 and Russell 2000, respectively. Needless to say, the small-cap under-performance did nothing to thwart the budding intermediate-term rallies.
It is worth noting one thing, however. Several of these occurrences were inclusive of the 6-month low within the measuring period. That is, the 6-month low took place during the S&P 500′s 2-week rally and the Russell 2000′s under-performance. That is a bit different than our present situation. The 6-month market bottom took place several weeks ago and, subsequently, both indices enjoyed a nice bounce. Thus, the 2-week measuring period has taken place after that initial bounce.
Looking at the data, those examples in which the 6-month low occurred prior to the past 2 weeks did not fare as well as the larger sample. In fact, 5 of the 6 2-month losses in both the S&P 500 and the Russell 2000 were accounted for by those occurrences when the market had bottomed prior to the past 2 weeks. Long story short – the current set-up has not been quite as bullish as those instances that included the 6-month low day in the 2-week measuring period.
Also along those “not so fast” lines comes our other study factor. We looked at those times in which the S&P 500 sat at a 2-month high following its 2-week rally (as was the case on Friday). The returns were not quite as promising. In fact, they were downright lousy.
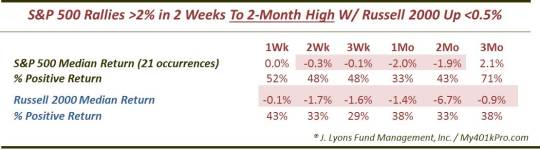
The median return was negative from 2 weeks out to 2 months for the S&P 500, and from 1 week to 3 months for the Russell 2000. And while the Russell 2000 led way higher in the previous table, it led the way lower here, bottoming out at a median loss of -6.7% 2 months out.
So which of these studies will set the precedent for our present case? Unfortunately, the present case is the only occurrence meeting the criteria for inclusion in both categories. Therefore, in a way, it has no precedent. If we had to pick one period that showed perhaps the most similarities, it may be late November 1998. The indices had bounced strongly off of a re-test low before the under-performance of the small-caps began. While the S&P 500 was at a 2-month high, it had narrowly missed forming a 6-month low the month before. For what it’s worth, both indices were lower 3 weeks later before rebounding over the longer-term.
So is the hand-wringing over the laggard small-cap space justified? We frankly did not know so we examined the issue. Upon further inspection…we are still not sure as the results were quite conflicting. Like we have said before, however, at least now we know what we don’t know – and even have a reason for why we don’t know. That’s always better than assuming you do know.
You know?
_______________
More from Dana Lyons, JLFMI and My401kPro.
The commentary included in this blog is provided for informational purposes only. It does not constitute a recommendation to invest in any specific investment product or service. Proper due diligence should be performed before investing in any investment vehicle. There is a risk of loss involved in all investments.


