Is The Stock Rally Running Out Of Fuel…Or Just Getting Going?

A 90% UP Volume Day on the 5th straight up day in the market may signal short-term exhaustion; but it has not prevented significant further eventual gains in the past.
We’ve discussed the concept of 90% days on several occasions in the past. These are days when at least 90% of the volume
(may refer to issues as well)
on a given day on an exchange occurs in either advancing issues or declining issues. Such one-sided volume may signify various things, When we’ve studied 90% DOWN Days, we’ve found that, very often, they occur toward the end of a decline, perhaps as a sign of capitulation (though, the exception is when occurring close to a 52-week high). 90% UP Days have been a bit less consistent of a marker of anything in particular. Although, as they have often occurred while emerging from some form of market low, the bias is probably slanted toward the positive side of the ledger.
We bring this up as we witnessed one such 90% UP Day on the NYSE today (10/5). In fact, nearly 94% of NYSE volume went to advancing issues today. That ranks as the 51st largest positive skew out of nearly 13,000 days since 1965. One interesting aspect of this 90% UP Day is that it occurred on the 5th consecutive up day in the S&P 500. Going back 50 years, this is just the 11th time a 90% UP Day has occurred concurrent with at least the 5th up day in a row.
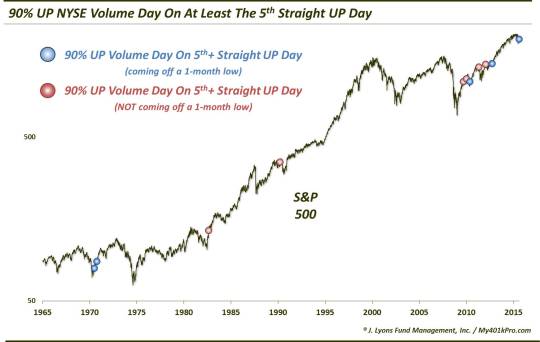
So is this a bullish show of momentum – or a sign that the market has spent its wad? Instinctively, we would guess that, at least in the short-run, the market has gotten ahead of itself. A mad rush into stocks (or out of shorts?) 5 days into a rally seems like upside capitulatory action to us. Luckily, we can look historically to see what kind of reaction stocks had following the 10 prior events.
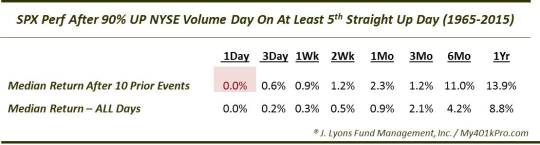
As it turns out, with the exception of the 6-month period, returns going forward following these such days have not been too far off of those following all days.
So that doesn’t help us here too much. However, breaking the events down further – as indicated on the chart above – may be a little more useful in isolating those more similar to the present case. Thus, we took the 10 previous 90% UP Days occurring on at least the 5th UP day in a row and broke them down into 2 categories: those occurring with the S&P 500 coming off of a recent 1-month low and those that were not. This breakdown created some separation in the return figures.
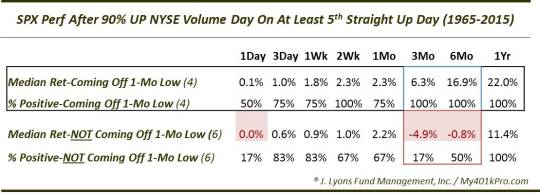
As the table shows, the events occurring while emerging from a recent 1-month low fared very well, especially in the intermediate-term. Beyond 1 month, all 4 of the occurrences saw positive returns, and healthy ones at that.
Conversely, the events that occurred when the S&P 500 was not emerging from a recent 1-month low saw some struggles, especially in the intermediate-term. Just 1 of the 6 events was positive 3 months later and just 3 were positive 6 months out.
Now, 10 occurrences in 50 years is not a very large sample. Thus, the read-through to today’s market based on the historical precedents should not be over-emphasized. What it does suggest, however, is that even when occurring after 5 Up days in a row in the market, a 90% Up Day can be an indication of demand momentum when it is coming off of a recent 1-month low. Therefore, while the stock rally may need a breather in the short-term, it should have plenty left in its tank in the intermediate-term, based on historical events.
_______
More from Dana Lyons, JLFMI and My401kPro.
The commentary included in this blog is provided for informational purposes only. It does not constitute a recommendation to invest in any specific investment product or service. Proper due diligence should be performed before investing in any investment vehicle. There is a risk of loss involved in all investments.


