Is There Still “Value” In Small Caps?

Small cap stocks have generally lagged following the early October spike; however, the VALUE portion of the space still looks constructive in the near-term.
In terms of market capitalization segments, the small cap space has been the object of scorn lately from the investment blogosphere. Considering the space has lagged behind its bigger peers since the early October bounce, perhaps the view is justified. Although, the small caps did lead during the bounce so its recent performance is probably largely a function of the group’s higher beta. One legitimate gripe is that, unlike the larger caps, the small cap space (as judged by the Russell 2000) has failed to make a higher high above its September 17 short-term cycle peak. The small cap arena is not one homogeneous group of stocks, however. And there is one portion of the space that presently looks a bit more constructive than the rest: small cap “value” stocks.
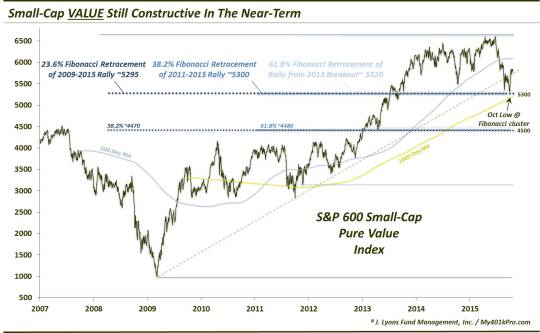
Using the S&P 600 Pure Value Index (SPSPV), there are several favorable things that small cap stocks have going for them. For starters, the SPSPV bounced exactly where it should have during the late September market rout.

The low close in the SPSPV occurred on September 29 at 5292. That was essentially spot on a cluster of 3 very significant Fibonacci Retracement levels:
- The 23.6% Fibonacci Retracement of the 2009-2015 rally ~5295
-
The 38.2% Fibonacci Retracement of the 2011-2015 rally ~5300
-
The 61.8% Fibonacci Retracement of the rally from the 2013 breakout level ~5320
We have stated several times the importance of a security or index bouncing “where they should”. When prices bounce at the key support levels identified on the chart, the security can be trusted to continue to follow the important charting markers. In this case, the SPSPV can be trusted to hold above its key support levels on the chart. Should the index break below these support levels, then things need to be reevaluated. However, as of now, the SPSPV has done “nothing wrong” as we say.
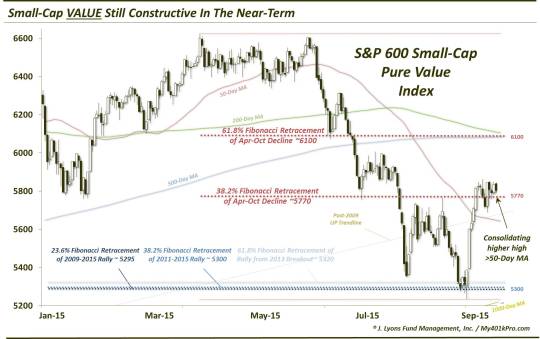
So what else distinguishes the small cap value space from the rest of the small caps? Taking a closer look, we see a few constructive characteristics on the chart, particularly when compared with the popular Russell 2000 small cap index. Here is the action of the SPSPV in 2015 alone.

First off, note the bounce following the late September low. Not only did the bounce occur from the right spot, it was robust. The S&P 600 Small Cap Value tacked on 11% in just 5 days. Additionally, note that, unlike the Russell 2000, the SPSPV made a higher high above the September 17 high. That is a noteworthy feat and tells us that – should we be looking at small cap exposure, the value arena has more evidence in its corner to suggest it is the most viable candidate.
Another piece of constructive evidence in the SPSPV is its action vis-a-vis its moving averages. The SPSPV overtook its 50-day moving average handily and has been consolidating above it, near the 5800 level, for the past few weeks. Meanwhile the small cap growth space as well as the broad Russell 2000 have waxed and waned on either side of their respective 50-day averages.
Conversely, the SPSPV is still well below its 200 and 500-day moving averages given the fact that the index got hit much worse than its growth and blended counterparts. While that is not the ideal spot to be in, it may offer the value space an advantage in the short-term considering it does not have to contend with those moving averages for some time. Meanwhile, the other small cap groups have had to contend with those longer-term moving averages and that certainly may account for some of their recent struggles.
Speaking of the 200 and 500-day moving averages, they are currently converging in the vicinity of the 6100 level. That gives the S&P 600 Small Cap Pure Value Index over 5% of “open air” should it be able to break above its recent consolidation highs.
Not surprisingly, this recent consolidation has occurred near another key Fibonacci line: the 38.2% Retracement of the April to October decline. Again we see the SPSPV “respecting” the levels that it should be. If the index is able to move above the consolidation highs, the next Fibonacci level above that it should “respect” is the 61.8% Retracement of the April-October decline. That level lies at 6100, the same area as the 200 and 500-day moving averages. Should the index make its way up there, that level should offer some stiff resistance.
So what could go wrong with this scenario? As always – plenty. First of all, in the longer-term the index has got its issues. It broke below its 50, 200 and 500-day moving averages, as well as its post-2009 UP trendline. Of course each of these levels can be reclaimed. However, significant damage has already been done and it has potentially weakened the index’s structure. Furthermore, the index has now formed a clear lower low below October of 2014. Should it form a lower high in here, we will have ourselves a downtrend, by definition.
And there is no guarantee that the SPSPV will break out of its recent consolidation to the upside. It is possible that the index is forming a short-term top now, at the 38.2% retracement level, and will resume its bear market again. So what is the line in the sand in terms of support levels?
A key spot in our view is the 38.2% Fibonacci Retracement of the October bounce, near 5625. If indeed the index is to continue to display relative strength and press on to higher highs, a bounce at that 38.2% could be critical. Additionally, it just so happens that the 50-day moving average is also approaching the 5625 area. That suggests the 5625 level may be one of great significance should the SPSPV reach that area. Should it hold, it may offer traders with their ideal entry point for a potential run higher. It may also be ideal since a failure there may signal the invalidation of the bullish scenario. Thus, traders would have a very close stop-loss point should the area fail to hold.
Lastly, in recent years, the small cap growth and small cap value segments have essentially been a revolving door of leadership. Just when one group has seemingly taken a grip on the leadership reins, the rug gets pulled and the other group takes over. Now this is partially a subjective observation and we like to keep our inputs limited to something we can measure. However, it has been enough of a tendency that we thought it was worth mentioning. We will certainly have a close eye on the proceedings for signs of another “switcheroo”.
The bottom line? Traders and commentators have turned particularly pessimistic on small cap stocks. There is certainly some evidence to warrant such skepticism. However, not all small cap segments are created equally. In our view, the small cap VALUE area currently offers a potentially attractive long set-up, especially compared with the small cap blend and growth areas. Bear in mind that this is only a short-term set-up and that the space still has plenty of longer-term challenges facing it.
However, for the near-term, we are not ready yet to throw out the value baby with the small cap bath water.
_______________
More from Dana Lyons, JLFMI and My401kPro.
The commentary included in this blog is provided for informational purposes only. It does not constitute a recommendation to invest in any specific investment product or service. Proper due diligence should be performed before investing in any investment vehicle. There is a risk of loss involved in all investments.


