“Just Remember…To Come Back In November”?

The flip side of “sell in May and go away” doesn’t get as much attention, but the historically best 6-month stretch of the year for stocks begins in November.
OK, maybe it doesn’t have the same ring to it as its counterpart “sell in May and go away”. However, the dearth of English words that rhyme with November is not an acceptable reason to pay the November-April stretch any less attention. As the
“sell in May…”
adage infers, the historical tendency is for the stock market to exhibit below-average performance during the 6 months from May through October. It follows, then, that the November through April period has, on average, delivered superior returns. Consider this a public service announcement to remind you that, while it may not have a catchy slogan, the historically best 6-month stretch of the year is upon us (although, there may be reason to slightly temper those expectations this year – more on that below). First, let’s review the performance of the past 6 “sell in May and go away” months.
On April 30, we covered this seasonal tendency, and the impending “sell in May…” period, specifically. As we wrote in that post, while folks continue to scoff at the adage, it has been impressively consistent and persistent for such a widely known pattern:
So, statistically, how much of an advantage does the November-April period have over the May-October period? Well, since 1900, these are the average returns of the Dow Jones Industrial Average (DJIA) for both of the 6-month periods:
* November-April returns have averaged +5.49%, with 70% positive returns
* May-October returns have averaged +1.67%, with 62% positive returnsIn case that does not impress people, consider this:
* $10,000 invested only during May-October periods since 1900 would have grown to $64,980.
* $10,000 invested only during November-April periods since 1900 would have grown to $3,573,094.
We also noted that there was perhaps some reason to be more hopeful about the upcoming May-October period, and also reason to be even more pessimistic. Based on the moderate gain in the DJIA over the period covering last November through April, the May-October period may bring better returns than normal, i.e., +4.97% on average following similar 6-month gains. On the other hand, the May-October returns during Year 3′s of the Presidential Cycle (e.g., 2015) have been lower than the historical 6-month average, though, only slightly at 1.57%.
So what was the tally? With October now in the books, the May-October return on the Dow Jones Industrial Average was -0.99%. Score another one for “sell in May and go away”. True, it may have been just a minor loss. But a loss is a loss and an investor would have been better suited “going away”. Furthermore, while years from now, all anyone will likely notice is an innocuous 1% loss, in “the moment”, we know better. The tiny loss belies the drawdown that holders had to withstand during the period. At the lows in late August, the DJIA was actually down over 12% from its April closing price. I think it is at least fair to give the notoriously weak 6 months some props once again based on the drawdown, even if you think such “seasonal” analyses are silly.
Let’s move on to the impending, and typically more profitable, 6 months which start on Monday. As noted, the November-April period has produced an average return in the DJIA of about 5.5% over the past 115 years, with 70% of the years showing gains. That is a pretty solid track record. So what was the factor that we said may temper our expectations a bit? It has to do again with the Presidential Cycle.
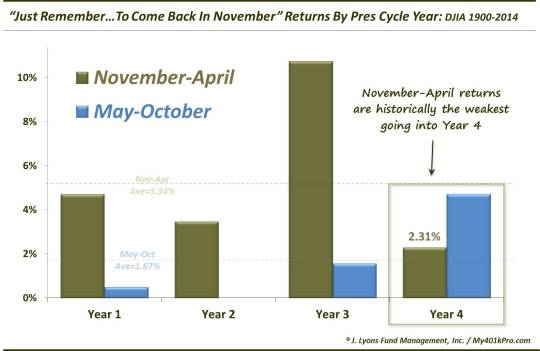
We are about to enter Year 4 of the cycle.
As the chart below shows, Year 4′s are unique as it pertains to the best/worst 6-month pattern. The tendencies are actually reversed. The May-October period has actually out-performed, on average, leading up to the election. Meanwhile the November-April period, which begins on Monday, has shown below-average performance, historically.
We don’t want to make too much of this Year 4 tendency, or the whole 6-month pattern in general. Seasonality is but a subtle headwind or tailwind for stocks. Other structural factors present at a given time in the market certainly will carry more influence. However, the pattern has been consistent enough over more than a century’s time that it deserves at least some mention.
At a minimum, if you paid heed to the “sell in May and go away” advice 6 months ago, it may warrant consideration to “remember…to come back in November”.
_____________
More from Dana Lyons, JLFMI and My401kPro.
The commentary included in this blog is provided for informational purposes only. It does not constitute a recommendation to invest in any specific investment product or service. Proper due diligence should be performed before investing in any investment vehicle. There is a risk of loss involved in all investments.


