Rare Breadth Thrust Has Been Dynamite For Stocks — Or Dismal

Last week’s uncommon display of broad market strength has historically led to either feast or famine, depending on the existing market climate.
“Breadth thrust” has been the buzz phrase on Wall Street over the past few days. This term describes a condition in which the stock market displays an inordinate level of positive breadth over the course of several days to several weeks. Such events have typically originated from a deeply oversold condition in the market and have often (though, not always) marked the springboard for substantial intermediate-term rallies.
Many market participants have been citing one such example called the “Zweig Breadth Thrust”, named after the indicator’s founder, Martin Zweig. However, a breadth thrust can be defined in countless different ways. One unique form of breadth thrust that we have tracked pertains to a statistic that measures the average daily percentage price move of all stocks on a particular exchange. For decades, this particular statistic has been supplied by an organization named Quotron, and distributed in Barron’s each week (I swear we are the only ones that look at this statistic and that they continue to publish it just for us…but maybe there are other users out there!).
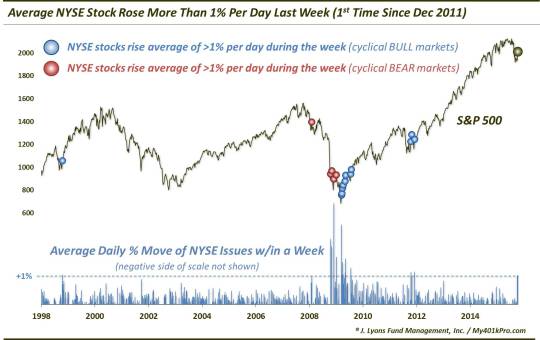
Quotron’s version of the statistic for NYSE stocks, called “QCHA”, did something rare last week. The average QCHA from Monday, October 5 through Friday, October 9 was 1.08%. That means that stocks on the NYSE rose an average of more than 1% per day last week. As our Chart Of The Day points out, this was just the 18th time in the last 17 years that this occurred.
So has the theory of the breadth thrust leading to a rally been borne out according to this measure? Yes and no. Much like the research we posted last Thursday on VIX drops from above 37 to below 20, this breadth thrust signal has led to results that are quite binary.
As the chart illustrates, a good deal of these signals (12 to be exact), occurred, not surprisingly, during the hyper-volatile period from late-2008 into mid-2009. 4 of those signals occurred between October 2008 and January 2009. These signals were, of course,
followed by a continued cascade lower in stock prices. The other 8 occurred as the stock market was emerging from the March 2009 low. Thus, they played the part of the “breadth thrust as rally springboard” to a T.
4 other occurrences took place in October 1998 and October 2011, just as stocks began their recoveries (springboard?) from near-20% declines. The remaining event happened in February 2008. This came following the first significant selloff within the cyclical bear market that began in late 2007. This signal was a dismal failure as stocks resumed their decline immediately afterward.
So of the 17 prior weeks that saw the average NYSE stock climb at least 1% per day for a week, 12 marked a traditional breadth thrust that provided a springboard for significant further intermediate-term gains. The other 5 marked the opposite: an immediate collapse in prices.
So what is the deal here? We’ll go back to what we wrote on Thursday regarding the all-or-nothing VIX signals. The delineating factor separating the two binary outcomes is the cyclical market environment that exists at the time of the signal. During cyclical (i.e., measured in years) bull markets, these breadth thrusts signify the end of market weakness and the beginning of a frenzied return to a “risk-on” environment. That is, a springboard to a rally.
During a cyclical bear market, a breadth thrust may be a sharp bounce in stocks that merely leaves the market in an overbought status at resistance. If there is no “risk-on” frenzy to build upon the breadth thrust and carry stocks further, they become vulnerable to the next leg lower within the bear market.
Unfortunately, this study only looks back to 1998 (we do have the data going back to 1970 somewhere in our archives, but I could not immediately locate it.) However, it is still long enough to get a taste of the significance of these breadth thrusts in which NYSE stocks rise an average of more than 1% per day during the course of a week. We know that these breadth thrusts have occurred as stocks kick-started rallies off of most of the major lows in recent times. However, we also know that the signal is not foolproof, having failed immediately and miserably on several occasions.
The key once again to determining which is the likely outcome in our present situation is to correctly identify the current cyclical market environment.
________
“Rocket Chimp” photo by Chetham’s Library.
More from Dana Lyons, JLFMI and My401kPro.
The commentary included in this blog is provided for informational purposes only. It does not constitute a recommendation to invest in any specific investment product or service. Proper due diligence should be performed before investing in any investment vehicle. There is a risk of loss involved in all investments.


