Stock Market Reaches Key Post-Crash Milestone

The average retest period following crashes similar to that in August have bottomed an average of 27 days after the crash…that would be today.
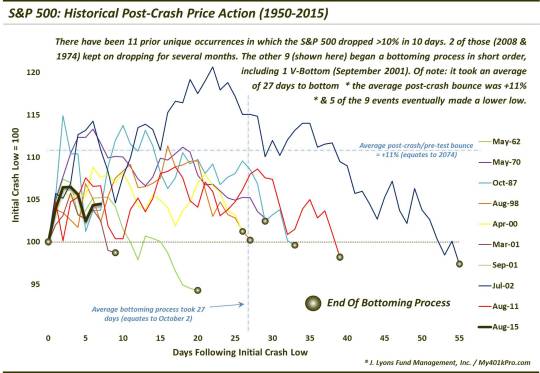
On September 4, we posted a chart showing the path of the S&P 500 following other “crashes” since 1950 that were similar to that which occurred at the end of August. Our goal was to lay out a general road map for how the index might behave in the weeks following the initial August 25 low. Specifically, we looked at drops in the S&P 500 of at least 10% within 10 days.
As it turns out, we identified 11 prior unique crash occurrences. Among the 11, 2 of them – July 1974 and September 2008 – continued to cascade lower, nearly unabated, for several more months. The other 9 resulted in an initial low in relatively short order. Here is the chart from that September 4 post:
What general takeaways did the chart present us? Here are a few noteworthy items that we wrote in the prior post:
- Of the 9, there was just 1 “V-Bottom” – September 2001 – that was never subject to a retest.
- The other 8 all went on to test the initial low at some point.
- 5 of the 9 eventually dropped below the initial low, if only marginally.
- The quickest retest/bottom process came after the March 2001 decline and lasted just 9 days.
- The longest bottoming process – following the July 2002 crash – lasted 55 days.
- ****The average bottoming process lasted 27 days (which would equate to October 2 in our present situation).****
- The median bounce between the initial low and the end of the bottoming process was +10%. That would equate to 2056 in our current circumstances.
- The majority of the crashes (5) came after significant damage had already been done, i.e., the S&P 500 was anywhere from -7% to -25% below its 52-week high when the crash began.
- The other 4 (1987, 1998, 2000 and 2011) began from within 2.6% of the S&P 500′s 52-week high. The recent crash started at just -1.25% below the 52-week high.
Our conclusion from that piece was this:
This examination would loosely suggest that the current bottoming process (assuming we are in one) may possibly persist for another month, with a possible higher bounce along the way before a possible retest of the August 25 lows.
Obviously we don’t like to feign certainty when dealing with markets, only probabilities and possibilities. Well, flash ahead to today and we see that the path of the S&P 500 has fairly closely followed the path of “possibilities” suggested by the prior post-crash events, i.e., a rally followed by a retest. Whether the retest of the past few days will be successful (i.e., hold) or not is obviously yet to be determined.
Related to that point, you will notice the significance of today, October 2, as it pertains to the asterisked bullet listed above. That is, the previous post-crash instances took an average of 27 days following the crash before they bottomed for good (as defined by “leading to a sustained multi-month rally”). 27 days following the August 25 crash low is today. We do not in any way expect that the current post-crash pattern will conform precisely to the average or median or any of the previous post-crash periods specifically. However, it does seem to be as good a time as any to update the chart to check on the S&P 500′s progress and its correlation to prior events. As mentioned above, it has followed the general path fairly closely.
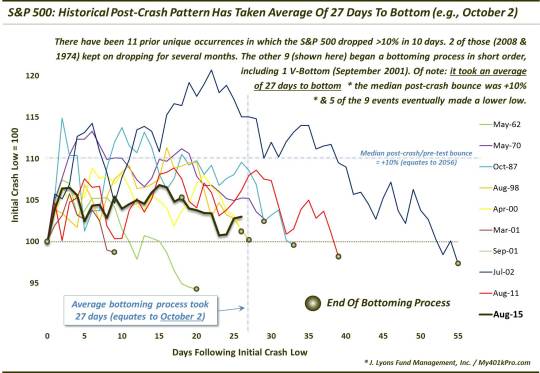
Today obviously cannot be THE low since it doesn’t appear that prices will eclipse the low from Tuesday by the end of the day. However, if Tuesday was the low (not a guarantee), it did occur in close proximity to the 27-day average of prior events. More importantly, the path of the S&P 500 has followed the general post-crash path that we laid out a month ago.
Again, whether or not the market has put in a post-crash bottom is yet to be determined. But we can see by this study that examining past patterns and price behavior attached to specific circumstances can be instructive of the reaction that prices may undergo in similar circumstances in the future. This is likely due to human nature. No matter what era one is dealing with, people will respond to various stimuli in a consistent and somewhat predictable fashion. And while we will never be able to predict price action with absolute precision, this kind of study can aid us in managing the probabilities in various situations. It certainly has aided us over the past month.
_______
More from Dana Lyons, JLFMI and My401kPro.
The commentary included in this blog is provided for informational purposes only. It does not constitute a recommendation to invest in any specific investment product or service. Proper due diligence should be performed before investing in any investment vehicle. There is a risk of loss involved in all investments.


