Unprecedented Level Of Equity Options Hedging For A Rally

Equity options trading was extremely
skewed toward puts yesterday, very unusual for a market that rallied strongly on the day, and over the past few weeks.
Like most metrics, equity options trading typically follows prices. That is, as prices go up, traders focus more heavily on calls and as prices go down, put volume tends to rise, relatively speaking. Yesterday’s action, however, produced a very odd situation. Despite the S&P 500 closing higher by 1.5%, equity options volume was heavily skewed toward puts. And it wasn’t just that way on one exchange either. It was consistent across exchanges.
For example, the CBOE Equity Put/Call Ratio registered .87 yesterday, i.e., 87 puts per 100 calls. Generally, anything over .85 constitutes heavy put volume relative to calls. Thus, yesterday displayed an extreme level of put buying, particularly for such a strong day in the market. As a reference:
Since 2002, the CBOE Equity Put/Call ratio has closed > .85 on 177 days prior to yesterday.
- The average move in the S&P 500 on those days was -1.21%
- Just 6 of those days saw the S&P 500 close up by more than 1.5% (4 of them between September-October 2008, once in March 2008 and once following the flash crash in May 2010)
From the other direction, since 2002, the S&P 500 has closed higher by 1.5% on 217 days prior to yesterday.
- The average level of the CBOE Put/Call ratio on those days was 0.63
- Obviously, just those 6 days referenced above saw a
CBOE Put/Call ratio above 0.85
Looking at the ISE options exchange, we see a similar story. The ISE reports its ratios opposite of the CBOE. For example, yesterday’s ISE Call/Put ratio was .87 (ISE calls it 87, but it should really be .87), i.e., there were 87 calls for every 100 puts. The fact that it was the same reading as the CBOE is a coincidence. However, .87 is a very low number, especially for a strong market day. Anything below 1.0 is typically considered a low figure, i.e., a high level of puts relative to calls. For reference:
Since 2005, the ISE Call/Put ratio has closed < 1.00 on 53 days prior to yesterday.
- The average move in the S&P 500 on those days was -0.57%
- Just 4 of those days saw the S&P 500 close up by more than 1.5% (once in March 2008, twice in February-March 2009 and on September 2 of this year)
From the other direction, since 2005, the S&P 500 has closed higher by 1.5% on 181 days prior to yesterday.
- The average level of the
ISE Call/Put ratio on those days was 1.68
- Just those 4 days referenced above saw the ISE Call/Put ratio below 1.0, and just once below .90 (September 2)
We can also easily combine the 2 ratios to get an aggregate look at the equity options situation across the two exchanges. We do that by simply dividing the CBOE ratio by the ISE ratio. Historically, readings of 1 or higher in this combined ratio have been a rare display of put buying versus call buying, as shown in today’s Chart Of The Day:
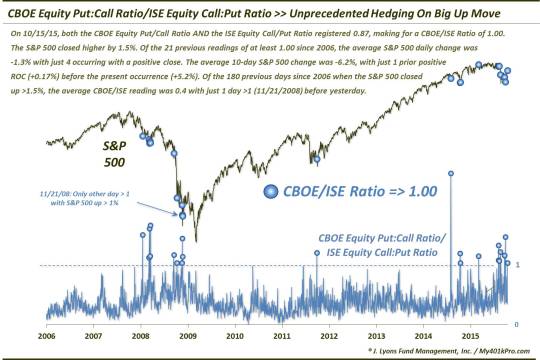
As the chart shows, since 2005, the CBOE Equity Put/Call:ISE Equity Call/Put Ratio has only registered 1.0 or higher on 21 days prior to yesterday. The timing of most of those days points to the unusual circumstances surrounding yesterday’s
occurrence.
Of the 21 previous days when the CBOE/ISE Equity Ratio was 1 or higher:
- The average change in the S&P 500 was -1.3%
- Just 4 other days saw the S&P 500 close higher (November 18 and 21, 2008 [only one >1%], October 14, 2014 and March 5, 2015)
From the other direction, since 2006 the S&P 500 has closed
up by at least 1.5% on 180 days:
- The average CBOE/ISE Equity Ratio was 0.4 on those days
- Just 1 of those days, 11/21/2008, saw the ratio > 1 before yesterday.
Furthermore, the environment wherein the CBOE/ISE Equity Ratio hitting 1.0 occurred is unusual. In the past, these readings have occurred within high-stress short-term environments. Even those occurrences on up days were mostly in the throes of serious short-term weakness. Yes, the market incurred a wicked selloff in the August-September period. However, we are well off of those lows now. That makes yesterday’s event even more odd. Consider:
As of yesterday, the S&P 500 was up 5.2% over the past 10 days. Of the 21 previous days when the CBOE/ISE Equity Ratio was 1 or higher:
- The average 10-Day change in the S&P 500 was -6.2%
- Just 1 other day saw the S&P 500 with a positive rate of change (March 5, 2015 at +0.17%)
From the other direction, since 2006 the S&P 500 has shown a 10-day rate of change higher than 5% on 110 days:
- The average CBOE/ISE Equity Ratio was 0.39 on those days
- The ratio had never closed =>1 before yesterday.
So I think we’ve demonstrated yesterday’s unusual circumstances whereby the market rallied strongly while traders were heavily buying puts versus calls. What is the takeaway from all of this? Well, like some of the data we’ve pointed out related to the continued elevated level of inverse ETF activity and the elevated level of bearish mutual fund assets, this indicates a degree of skepticism towards the current rally. This should be unequivocally bullish for equities as it represents the “wall of worry” that markets like to climb. As long as there is a healthy dose of skepticism, there is potential buying power left to enter the marketplace.
Looking at previous occurrences when the CBOE/ISE Ratio hit 1.0 or higher, this has indeed been the case. Prior to 2015, there were 14 instances when the ratio rose to 1.0 or higher. 1 month following those instances, the S&P 500 was higher 13 of 14 times, with a median return of 5.8%. That is the evidence to back up the short-term bullish argument behind this data point.
But…there is one caveat. Prior to yesterday, there had been 7 occurrences this year in which the CBOE/ISE ratio reached 1.0 or higher. 2 occurred a few weeks ago so they have not registered a 1-month return. However, 1 month following the other 5 (on March 2 and 4 times in August), the S&P 500 was lower every time by a median of -5.2%. Of course most of those occurred as a result of one event, the late-August mini-crash. However, the point is – in those instances, traders were correct in their heavy put buying. And though the historical evidence shows that this skepticism should be bullish for stocks, at least a little added weight should always be placed on recent data. Thus, the 2015 events do at least give us some pause.
All in all, however, the extraordinary – and unprecedented – level of put activity relative to calls yesterday suggests a bullish influence for stocks going forward. It is especially so given the strong market action yesterday and over the past few weeks. We have never before witnessed this type of hedging activity in the face of market strength. Yes, given the readings this year, there may be some doubt as to whether this situation points to as bullish a set-up as it has in years past. However, in sum, we would view this situation as bullish from a classic contrarian sentiment perspective.
_______________
“Dark Hedges” photo by Andrew Gibson.
More from Dana Lyons, JLFMI and My401kPro.
The commentary included in this blog is provided for informational purposes only. It does not constitute a recommendation to invest in any specific investment product or service. Proper due diligence should be performed before investing in any investment vehicle. There is a risk of loss involved in all investments.


