Broad Market Survives Another Test…For Now

A key broad market index overcame an important hurdle, buying it more (though, perhaps limited) time and space.
On September 29, we penned a not innocuous post titled “U.S. Stocks Facing Their Biggest Test In 8 Years?”. The piece referred to a test of critical support by the Value Line Geometric Composite (VLGC), at least in our view. Once again, the VLGC is an unweighted index of approximately 1700 stocks, using the median stock change. Due to this construction, the VLGC is,
in our opinion, the best gauge of the true health of the overall broad stock market. Thus, the fate of the September 29 test would reveal a great deal about the nature of the correction at the time, and quite possibly the likelihood of survival for the post-2009 bull market. Here is one of the charts from that September 29 post.
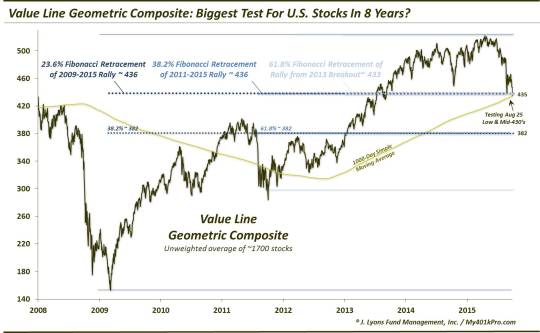
The support that the VLGC was testing at the time – around 435 – was primarily identified by us based on Fibonacci Retracement analysis. Specifically, 3 major Retracement lines were clustered around that precise level, as we noted in the September 29 post:
- The 23.6% Fibonacci Retracement of the 2009-2015 Rally ~436
- The 38.2% Fibonacci Retracement of the 2011-2015 Rally ~436
- The 61.8% Fibonacci Retracement of the Rally from the 2013 Breakout Point to the April High ~433
- Additionally, the 1000-day simple moving average (approximately, the 200-week moving average) lay at 435.
Well, one can certainly argue the hyperbolic nature of our focus on that VLGC test on September 29. However, one thing that is pretty incontrovertible is the timing and accuracy of the level that we deemed to be so crucial. That’s because the VLGC – and the rest of the market – bottomed on that exact day, initiating the furious rally of the past 5 weeks. Test passed.
We’ve said it before and it bears repeating: when prices adhere to, or respect, levels based on various charting analytics, it increases confidence in the validity of those levels. Thus, we kept an eye on the index as the subsequent 8-day rally brought the VLGC up to the next cluster in the sequence of Fibonacci Retracements around 470:
- The 23.6% Fibonacci Retracement of the 2011-2015 Rally ~470
- The 38.2% Fibonacci Retracement of the Rally from the 2013 Breakout Point to the April High ~469
- Also, the approximate mid-September high
Yes, these levels marked potential support Retracements of rallies, not potential resistance Retracements off of declines. However, again, when prices have respected levels so closely, they will tend to continue to do so, even working “in reverse”. Furthermore, the 38.2% Fibonacci Retracement of the April-September decline in the VLGC was also in the same vicinity at 467.
How did prices react at 470? Like they had hit a stone wall. Over the next 3 weeks, the VLGC moved sideways, failing to even once overtake that 470 level. This occurred even as the major cap-weighted indexes continued to soar. The S&P 500 rallied by nearly 4% over that period, and the Nasdaq 100 by over 6%.
It was during this period over the past 3 weeks that we began to notice – and post extensively on – the relative under-performance of the broader market versus the major averages. That lack of participation, i.e., thinness, caused us to be somewhat concerned about the durability of the rally.
With Monday’s big up move in the markets, that concern was somewhat alleviated, for now. The breadth and the broader indexes stepped up their participation levels markedly on Monday. For the Value Line Geometric Composite, that meant breaking strongly above the 470 level that had served as a ceiling for nearly a month. That is good news for the VLGC, and for the health of the broad market rally…for now.
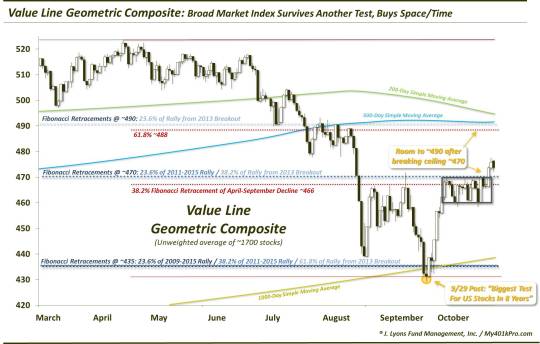
As the (admittedly busy) chart shows, the VLGC bottomed on the very day as the “Biggest Test” post on September 29, holding at that key cluster of Fibonacci Retracement support around 435. The subsequent rally bounced to the next set of Fibonacci Retracement levels around 470, where the index would stagnate for 3 weeks.
That level marked the next significant test for the broad Value Line Geometric Composite. With the rampant under-performance by the broad market during that time, failure at that level could have been dangerous for the post-September rally’s prospects. Thus, the recent breakout indicates a slight broadening of the rally and, importantly, opens the door for more gains for the VLGC.
How much more gain? Well, continuing with the Fibonacci sequence that has worked so well, the next level lies around 490. This level is interesting as it also includes a confluence of other noteworthy chart analyses:
- The 23.6% Fibonacci Retracement of the
Rally from the 2013 Breakout Point to the April High ~490
- The 61.8% Fibonacci Retracement of the April-September Decline ~488
- The 500-day simple moving average lies at ~490
- The 200-day simple moving average lies at ~493
- Additionally, the underside of the broken post-2009 UP trendline.
Now, the potential upside marked by the 490 level is only about 4% from current prices. Thus, despite the VLGC surviving another test, the upside to the next key resistance level is not all that substantial. Therefore, while the breakout is certainly welcomed by the bulls, and it buys the rally more time and upside, it won’t be too long before the index is faced with yet another big test.
________
Logo adopted from CBS’ “Survivor” TV show.
More from Dana Lyons, JLFMI and My401kPro.
The commentary included in this blog is provided for informational purposes only. It does not constitute a recommendation to invest in any specific investment product or service. Proper due diligence should be performed before investing in any investment vehicle. There is a risk of loss involved in all investments.


