Has The Post-Crash Rally Run Its Course?

Is the post-September rally already over…or is it just getting started? The answer likely depends on what market climate we’re in now.
Back on September 4, we wrote a piece that looked at previous market crashes similar to what unfolded in late August.
Our objective was to try to ascertain any patterns that may instruct us as to what to expect going forward following the August selloff.
Obviously, the word “crash” is subjective and may or may not ring true for some folks when applied to recent events (especially to those who witnessed a true crash in 1987). However, for comparison purposes, we defined it as a 10% decline in the S&P 500 within 10 days.
Under that definition, we identified 11 prior, unique occurrences going back to 1950. As we wrote in that post:
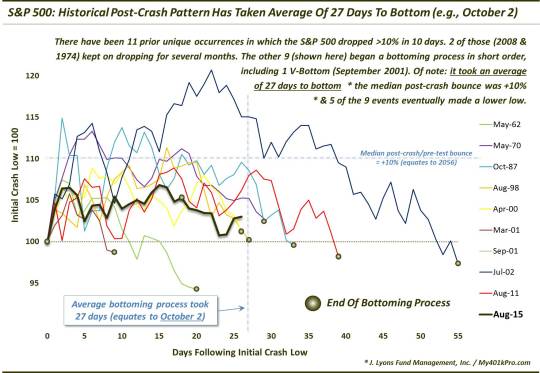
Among the 11, 2 of them – July 1974 and September 2008 – continued to cascade lower, nearly unabated, for several more months. The other 9 resulted in an initial low in relatively short order. By initial low, we mean the first step within a market bottoming process. Those 9 are the subject of today’s Chart Of The Day, and this post. These are the months containing the 9 dates:
May 1962
May 1970
October 1987
August 1998
April 2000
March 2001
September 2001
July 2002
August 2011
After examining the S&P 500′s price pattern following these dates, we concluded that:
This examination would loosely suggest that the current bottoming process (assuming we are in one) may possibly persist for another month, with a possible higher bounce along the way before a possible retest of the August 25 lows.
As it turns out, events unfolded remark close to that script. The S&P 500 did bounce into mid-September, before moving on to re-test the August lows – a process that took almost precisely one month.
Perhaps we should not be surprised that the post-crash bounce/retest scenario played out so closely to historical precedent. The reason we say that is a “crash-like” market occurrence is a highly psychological event. Thus, investors’ reactions in such scenarios will tend to be consistent across occurrences – not identical but similar. Furthermore, the crash process is a relatively contained event – time-wise – so there tends to be less variance in the general reaction throughout the process on the part of investors.
The rally subsequent to a crash event is another matter. And that is the subject of our Chart Of The Day and today’s post. We looked at the same 9 post-crash events plotted in the chart above and studied each of the rallies following the end of the bottoming process, i.e., after any re-test was complete.
What we found was that the rallies were not as correlated as the crash-to-retest process was across the events. Rather, the character of the post-crash rallies was more dependent upon the existing cyclical market environment. That is, during cyclical bull markets, the rallies were longer, stronger resumptions of the bull. During cyclical bear markets, they were shorter, shallower “bear market rallies”.
Here is a chart of the 9 post-crash rallies, along with the current bounce through yesterday (11/12). (Sorry for the busy chart – the annotations are for the benefit of our Twitter and StockTwits followers. You can follow us at both places at @JLyonsFundMgmt).
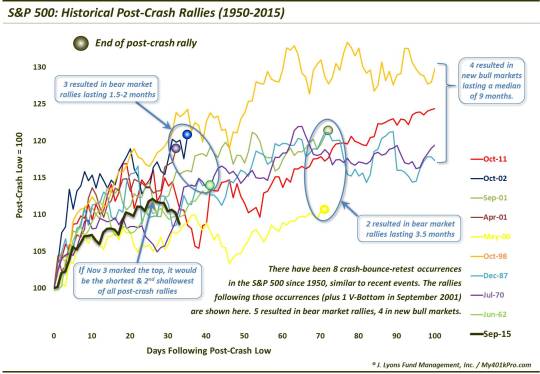
If you can make it out on the chart, the post-crash rallies fell into 2 regimes. 4 occurred within cyclical bull markets (the month signifies when the rally kicked off):
July 1970
December 1987
October 1998
October 2011
These rallies were really resumptions of the existing cyclical bull markets, although the 1970 event kicked off a new cyclical bull market. These rallies were extended affairs, lasting anywhere from 6-18 months.
The other 5 occurred within cyclical bear markets.
June 1962
May 2000
April 2001
September 2001
October
2002
The May 2000 event initiated that cyclical bear market. These events happened to be shorter-term “bear market rallies”. The 1962, April 2001 and 2002 rallies peaked after just 1.5 to 2 months, gaining between 14%-21%. The 2000 and September 2001 occurrences lasted a little bit longer, at roughly 3.5 months. They gained 11% and 21%, respectively.
So what about the current rally? Well, the S&p 500 peaked, thus far, on November 3. That was Day 26 of the rally, or barely over 1 month. Its gain at that point was 12%. How does that stack up? Even versus the bear market rallies, it would be the shortest and second shallowest (next to 2000) of any of the rallies on the chart.
Could the rally be over? Its possible. Though, if it is, it would be the outlier on the chart. That is not to say it can’t be. Every study has to have a winner and a loser. It’s just tough sometimes to imagine that the event you are presently studying is the outlier.
For now, we’ll leave it at that. Is there more left in the tank to the post-September rally? That likely depends on if the post-2009 cyclical bull market is intact. If so, then there is potentially a lot left in the rally. On the other hand, if the August crash ushered in a new cyclical bear market, then it is possible that the rally has run its course. Although, it would have been an especially anemic one, even for a bear market rally.
_______
More from Dana Lyons, JLFMI and My401kPro.
The commentary included in this blog is provided for informational purposes only. It does not constitute a recommendation to invest in any specific investment product or service. Proper due diligence should be performed before investing in any investment vehicle. There is a risk of loss involved in all investments.


