Warren Buffett Has Lost It…Again
Shares of Berkshire Hathaway are breaking down – at least on a relative basis.
Well, it looks like he’s lost it again. Warren Buffett, that is. Based on the recent stock performance of his Berkshire Hathaway Inc. (BRK), Mr. Buffett has lost his knack for investing. You may notice that this meme has echoes of those espoused circa 2000 and 2006 when BRK also through suffered through agonizing bouts of under-performance. If you are sensing a note of sarcasm here, it’s because I am laying it on pretty thick. BRK shareholders can only hope the current “dry spell” turns out like those in 2000 and 2006 which resulted in out-performance versus the S&P 500 of roughly 11,000 and 8,000 basis points, respectively, over the next 2 years. True, a good deal of that can be attributed to the S&P 500′s sizable declines during those periods. However, an underrated aspect of successful investing is the ability to avoid blowing up one’s portfolio.
That said, as shown in the chart below, there is at least some objective criteria on which to base the present claims of under-performance. Using a comparison versus the S&P 500 again as a basis, BRK’s stock just recently experienced an inauspicious development. The ratio of BRK relative to the S&P 500 broke below an UP trendline that has been in place since 2001.
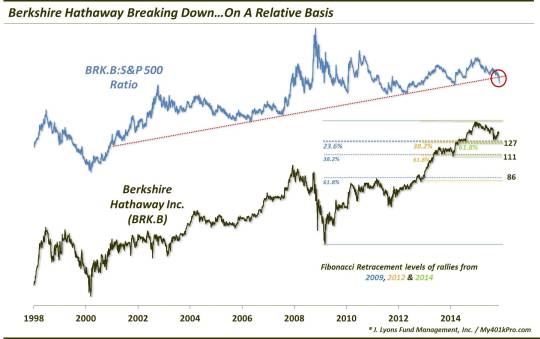
True, BRK’s price itself has not come close to even its post-2009 UP trendline, and pure price is what is most important. However, as you can see in the chart, relative to the S&P 500, BRK has broken below a well defined UP trendline. This trendline has acted as support for 14 years, including touches in 2001, 2006, 2007, 2012 and 2014.
What are the ramifications of this development? Well, since it is a relative data series, there are 2 components: BRK and the S&P 500. The breakdown means that either BRK is weak, the S&P 500 is strong, or some combination of the two. In this instance, it seems like a combination of the two.
First, thanks to laggard holdings like IBM and Wal-Mart, BRK has been in a steady downtrend since hitting an all-time high last December. Considering that, during the same time, the S&P 500 has served as a poster-child for this thinning, mega-cap dominated recent stage of the bull market, it is not surprising to see the relative breakdown in BRK.
Does this mean go out and sell all your Berkshire Hathaway shares (or share)? Nah. It just means that there have been much better stocks (or, even index funds) to own this year than BRK. This recent relative breakdown suggests that that trend is likely to continue (though, as in 2001 and 2008, by the time the ratio improves in BRK’s favor again, you may be wishing you had held onto the stock).
From a pure price perspective, we have labeled on the chart some key levels to monitor for signs of either potential support or breakdowns in price itself. These levels are based on Fibonacci Retracements of the rallies from 3 key lows, the 2009 low, the 2012 breakout level and the February 2014 low, to the December 2014 high. The most nearby level to watch is approximately 127, signified by the following key points:
- 23.6% Fibonacci Retracement of the 2009-2014 rally
- 38.2% Fibonacci Retracement of the rally from the 2012 breakout to December 2014
- 61.8% Fibonacci Retracement of the February 2014-December 2014 rally
BRK shares did indeed hold this key 127 level in August, September and October. And while the bounce off of those lows has not been impressive to say the least, as long as that level holds, BRK has a chance to move higher. If it breaks, the key levels below there are simply the next in the Fibonacci progression. These would be near 111 and 86.
Now is there a larger message to the relative BRK breakdown? Given BRK’s status as a diverse conglomerate and potential bellwether, might this be a negative sign for the market as a whole? Actually in a post in August 2014, we argued just the opposite. At the time, BRK’s stock was arguably breaking out versus the S&P 500, in a similar fashion as 2001 and 2008. Our theory was that Mr. Buffett’s value-focused philosophy enables BRK to withstand substantial corrections in the market relatively well. Thus, the breakout of the BRK:S&P 500 ratio may be indicative of a developing “risk-off” period.
That argument turned out to be a non-starter as the market has obviously not entered into a sustained risk-off phase (although, it is possible that the past 15 months have been part of a longer-term topping pattern). However, we still believe the theory is sound one. If that is indeed the case, then based on BRK’s relative breakdown, perhaps there is still another risk-on, valuation-be-damned, cue-the-animal-spirits run higher for stocks.
In the end, what the relative breakdown in Berkshire Hathaway stock really means is that there are simply other stocks offering better performance at this time. But while you may come across thinly veiled “Warren Buffett has lost it” articles, it’s probably wise to avoid tugging on Superman’s cape.
________
Warren Buffett photo by Rick Wilking, Reuters.
More from Dana Lyons, JLFMI and My401kPro.
The commentary included in this blog is provided for informational purposes only. It does not constitute a recommendation to invest in any specific investment product or service. Proper due diligence should be performed before investing in any investment vehicle. There is a risk of loss involved in all investments.


