Horrific Breadth For A “Rally”

Despite yesterday’s rally in the major indices, the underlying breadth statistics were historically weak.
After a steep selloff to begin the day yesterday, the stock market rallied late to close with solid gains. At least, the major large-cap averages did. The broader, smaller-cap indices mostly closed with losses on the day. Furthermore, the market’s internals, e.g., Advance-Declines and New Highs-New Lows, were very weak. When considering the major averages closed the day higher, the internals, or “breadth”, were historically weak. Thus begins another post on weak breadth. This one is a bit different, however. It is possible that the breadth was so poor that it is actually a positive. Let’s take a look at a few examples.
First off, while the S&P 500 closed the day higher by nearly a half of a percent, there were just 810 Advancing Issues on the NYSE vs. 2326 Declining Issues. As a percentage of the total, the Advancing Issues equated to just 25.8% of issues. If that sounds low, you are correct. Going back to 1965, it is in fact the 3rd lowest percentage of Advancing stocks of ANY day that the S&P 500 closed higher. In other words, out of 6,702 Up days since 1965, yesterday ranked 6,699th in terms of breadth.
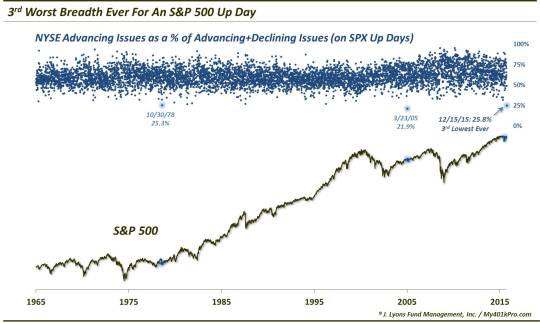
The only 2 up days in the S&P 500 since 1965 that saw worse breadth than yesterday were November 30, 1978 and March 23, 2005. While it’s difficult to make too much of 2 precedents, both of those days bore at least some resemblance to our present circumstances. The 2 days came following multi-week declines, the 1978 occurrence being a tad worse at a drop of over 10%. The days also saw lower lows intra-day, with the 1978 occurrence down nearly 3% at one point before closing higher. The apparent conclusion is that the large-cap indices were simply able to mount a rebound faster than the rest of the market could, for whatever reason.
After both days, the S&P 500 tried to hold the respective closing levels, chopping around for a few weeks. By a month later, though, the index did make a new low by about 3% both times. However, both of those dips would mark the low for the index for the next few years. While we’re not suggesting that one take the data point for a long-term bottom signal, it also was not the sign of impending doom that one might have feared.
In a way, it could be argued that the weak breadth was so bad that it marked some sort of oversold reading concurrent with the daily reversal in the S&P 500. If we dial back the weakness of the breadth reading a bit, we don’t see the “oversold”, mean-reversion tendency that we noted in the 2 occurrences above. Specifically, looking at days when the S&P 500 closed higher and NYSE Advancing Issues were between 26%-35% of issues, we see pretty consistent weakness in the shorter-term, historically. Here are the results following the 30 such days since 1965.
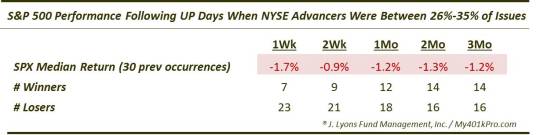
It’s hard to make much of anything from this data point. On the one hand, the weak breadth may have been so weak that it marked an oversold extreme with the S&P 500 merely being able to reverse more quickly than the broad market. On the other hand, when lowering the threshold to allow more precedents even though the breadth readings were not quite as bad, we see some consistent weakness in the short to intermediate-term time frame. In all, we would probably tend to chalk this one up to an interesting bit of trivia rather than any type of indicator to hang one’s hat on.
However, another bad breadth data point from yesterday may prove a bit more helpful. Looking at New Highs and New Lows, we saw a remarkable statistic. Last week, we noted the unusual circumstances whereby over 10% of all NYSE issues made New Lows while the S&P 500 was within 3.5% of a 52-week high. That has occurred just 15 times since 1970. Yesterday’s feat was even rarer. At 660, NYSE New Lows accounted for more than 20% of all NYSE issues. Meanwhile, the S&P 500 closed within about 5% of its 52- week high. Since 1970, there have been just 3 other days meeting that criteria.
If we broaden the net a little to within 10% of a 52-week high, we find just 10 total days since 1970. Those events are shown on the following chart.
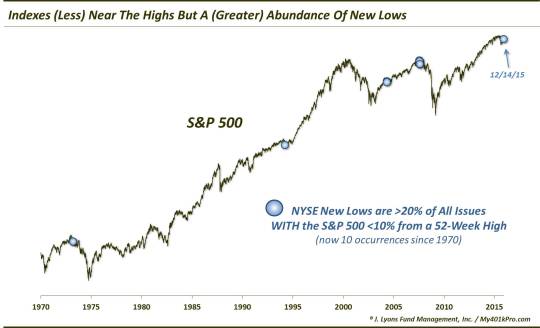
What makes this such a rare combination is the fact that the condition of 20% of NYSE issues being at New Lows is typically representative of a highly washed-out market. Since 1970, that condition has occurred on just 113 days. The average distance of the S&P 500 from its 52-week high on such days is right at -25%. Therefore, for so many New Lows to be present with the index so near to its high is extremely unusual.
The question is – does it still represent a washed-out condition? Or, being closer to the top, does it indicate potentially more downside risk for the major averages in order to catch up to the broad market weakness? Our answer is – it depends.
It depends on what type of market regime we are in. We’ve discussed this consideration many times over the past 6 months when dealing with similar data points. Looking historically, many of these such extremes have led to very good markets or very bad markets. How can binary outcomes following similar data be possible? Again, it all depends on the larger stock market environment.
For example, when within the confines of an ongoing bull market, these circumstances will often represent ideal buying opportunities. With limited downside in such markets, these conditions may be as washed-out as the market is going to get. On the other hand, if entering a new bear market, a substantial deterioration in market internals with the major averages close to their highs may be a head’s up that the rally is running out of gas and the market is susceptible to rolling over.
Indeed, this appears to be the case, historically, as it pertains to this study. The previous 9 occurrences really came at just 4 unique times: March 1973, April 1994, May 2004 and July-August 2007. We wish there were more precedents, but that just underscores how unusual yesterday’s action was.
In this table, you can see how truly binary the results were following these circumstances:
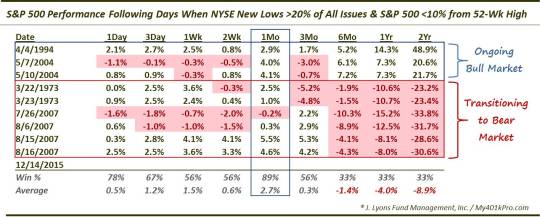
The 1994 and 2004 events occurred within ongoing bull markets. Thus, you can see that after some chop in the shorter-term, the long-term results were robust.
Conversely, the 1973 and 2007 events occurred as the market was transitioning from a bull to a bear market. Therefore, while some chop ensued in the near-term again, the longer-term was decidedly weak.
Interestingly, the most consistent time frame across all events was the 1-month period. 8 of the 9 events saw positive returns a month later at an average of +2.7%. The only loss was a paltry -0.2%. We really don’t know if there is something significant about that time frame, or if it is merely a coincidence. Thus, we’ll take that result with a grain of salt.
The binary results in the longer-term could not be more clear, however. If the current market is to follow 1 of those 2 paths, the answer likely lies in the correct interpretation of the present location of the market cycle. Are we poised to continue this bull market, or is a bear market just around the corner? We know what our vote is.
In our view, from a myriad of technical, fundamental and cycle analyses, the market presently resembles one that is on the verge of a potential transition to a bear market. The washed-out condition may still produce a short-term bounce, however, we feel the market is more similar to the 1973 and 2007 occurrences. Therefore, the longer-term picture may not be so pretty.
So we saw a number of examples of historically bad breadth yesterday, especially for an Up day. Interestingly, a study of similar days historically does not lead to an unambiguously bearish conclusion like so many of these posts have in recent months. The reason is that the breadth was actually so bad that it potentially marked a washed-out condition, often preceding a bounce. From a longer-term perspective, we found that these conditions have led to either very good or very bad markets depending on the overall market environment. As with many similar posts over the past 6 months, our inclination is to side with the “bad market” view.
It is our belief that the stock market is quite likely near a cycle top environment. Given that, we view the continued signs of deteriorating breadth as an indication of elevated risk for the broader market.
_________
“Breath of Life” photo by Ian Iott.
More from Dana Lyons, JLFMI and My401kPro.
The commentary included in this blog is provided for informational purposes only. It does not constitute a recommendation to invest in any specific investment product or service. Proper due diligence should be performed before investing in any investment vehicle. There is a risk of loss involved in all investments.


