On “Average”, Stocks Are Testing The Post-2009 Uptrend
At this moment, an index that tracks the average stock move is testing the uptrend since 2009.
We talk often about the Value Line Geometric Composite (VLG). To refresh, the VLG is an unweighted index of about 1700 stocks that essentially tracks what the median stock in the market is doing. As such, we believe it is the truest measure of the health of the broad market. Most recently (on Monday), we noted that the VLG was testing what we have called a “pass/fail” level on its chart. That is, the response of the VLG at this level may tell us a lot about whether the next big move in the market is up or down. It may even, arguably, dictate the fate of the post-2009 cyclical bull market for the broad market of stocks. The VLG passed the test on September 29. We’ll see if it can pass it again here.
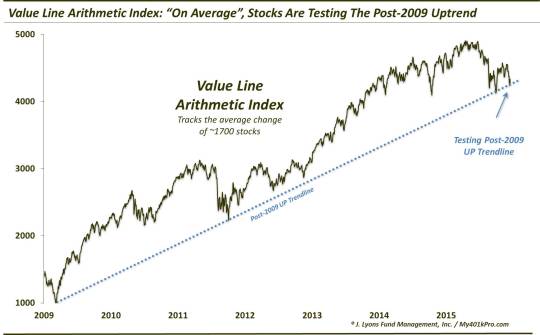
Well, the VLG has a sister index called the Value Line Arithmetic Index (VLA). What the VLA does is track the average move of the same ~1700 stocks. So it is similar to the VLG but can be more heavily influenced by big movers. Like the VLG, the Value Line Arithmetic Index is testing a key price level as well. Specifically, it closed today right at the Up trendline extending from the 2009 low.
Now, like the VLG, we are not aware of any investable instruments tied directly to the VLA (there used to be a VLG futures contract). Thus, you may wonder why we bother looking at the index – and how could we reasonably apply technical analysis to the VLA chart.
To answer the 2nd question, in our extensive experience, it’s because prices tend to adhere closely to basic technical tools even though no one is trading the index directly. Witness the post-2009 Up trendline, extending from 2009 and up through the 2011 lows. At the late September low, the VLA held precisely at the trendline. Is that mere coincidence? We don’t think so.
So why bother looking at the index anyway? Well, precisely because it does tend to follow some of the basic TA and charting tools. Therefore, the behavior of the VLA can be very instructive regarding the health of the broad stock market. For example, when the index was the first to break out to all-time highs in 2010 = healthy. When the VLA failed to make a new high along with the major averages in May = unhealthy. When the VLA failed to get closer than 7% from its April high during the post-September bounce = really unhealthy.
Therefore, although nobody is trading the index, we can still glean valuable information from it. And the information we’ve been getting from the VLA points to an unhealthy state of affairs in the broad market. Importantly, we will watch the present test of the post-2009 Up trendline. If the VLA can hold here, perhaps a year-end rally can still materialize.
If the trendline fails to hold (like it did for the VLG in August), then the market may be in for a further decline. And considering the magnitude of the trendline being broken, it may not be just your “average” decline.
_________
More from Dana Lyons, JLFMI and My401kPro.
The commentary included in this blog is provided for informational purposes only. It does not constitute a recommendation to invest in any specific investment product or service. Proper due diligence should be performed before investing in any investment vehicle. There is a risk of loss involved in all investments.


