New Lows Hit ‘Wash-Out’ Territory

The number of New 52-Week Lows on the NYSE has reached levels historically consistent with a ‘washed-out’ market.
Just a week ago, we penned a piece called “Complacent Correction Cause For Concern?”. The premise was that, at least according to the S&P Volatility index (VIX), the level of fear in the market was not commensurate with the magnitude of the stock decline. In fact, the VIX was at the lowest level in its history during any such corresponding S&P 500 decline. Our takeaway was that until signs of fear and capitulation began to materialize, more downside risk remained in stocks. Sure enough, the market has continued to crater since then. However, we may be starting to see signs of capitulation – or, “wash-out” – that could suggest the worst of the selling pressure is almost behind us (for now).
What are these signs? One source of potential clues is in the breadth, or internals, of the market. At times, a massive skew in the level of declining issues or volume versus advancers can signal a tipping point whereby market participants demonstrate a near-unanimous desire to “get out” of the market at the same time. Such capitulation often appears at the end of significant selloffs. We saw an example of such a wash-out day on August 24 of last year as the internals were historically skewed to the negative side.
The internal skew signal can also be found in the ratio between New Highs and New Lows on an exchange, or merely just the level of New Lows. An abundance of New Lows can signal a washed-out market whereby most participants have already sold and little immediate selling pressure remains. We wrote about this series yesterday as the New Lows on the NYSE registered at least 15% of all issues on the exchange for a record 8 consecutive days. Well, you can extend that record to 9 days with today’s reading. Furthermore, by any historical measure, today’s reading on NYSE New Lows hit true washed-out levels.
Consider this: there were 1410 New Lows on the NYSE today. That is the 6th largest total in history (going back to 1970). And outside of the 2008 financial crisis, it is the single highest reading ever. As a percentage of total issues, it is equally extreme. At 43% of all issues, today marked just the 16th day since 1970 with over 40% of all issues hitting New 52-Week Lows.
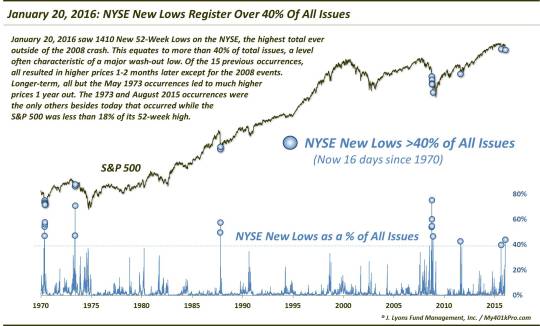
As the chart illustrates, these 40% New Low days have normally occurred near the very bottom of substantial declines. These include major lows in 1970, 1987, 2008, 2011 and August 2015. Here are all 16 days that hit the 40% mark since 1970.
Date % Issues At New Lows
5/14/1970 47%
5/21/1970 54%
5/25/1970 56%
5/26/1970 58%
5/21/1973 47%
5/30/1973 71%
10/19/1987 50%
10/20/1987 58%
10/6/2008 54%
10/8/2008 60%
10/9/2008 55%
10/10/2008 75%
11/20/2008 47%
8/8/2011 43%
8/24/2015 40%
1/20/2016 44%
Of the 15 previous occurrences, all resulted in higher prices in the S&P 500 1-2 months later except for the earlier events in 2008. So this is one data point that would argue for an intermediate-term bounce over the next few months. Longer-term, the returns are even better, with 12 of the 14 showing a positive 1-year return, at a median of +21%.
However,
like yesterday’s post, there is a caveat. The only failures over the subsequent 1-year period were the 1973 instances. And while the vast majority of occurrences led to 1-year gains, the 1973 setup perhaps most closely resembles our present circumstances. At least, that one and the August 2015 occurrence.
Why? The other 13 occurrences saw the S&P 500 a median of 30% off of its high. The 1973 and August 2015 events occurred while the S&P 500 was about 11%-12% off of its 52-week high. Where are we now? Just over 12% away from the S&P 500′s 52-week high. The point is that the other 13 occurrences were arguably more washed-out on a longer-term basis. The fear is that our present case ends up more like the 1973 version in which the S&P 500 proceeded to drop another 40% over the following 18 months of a cyclical bear market.
So the good news for bulls is that some signs of capitulation are beginning pop up. Thus, we would not be terribly surprised to see the pendulum swing to the bulls favor, at least over the short to intermediate-term. However, beyond that, the troubling longer-term warning signs remain, including perhaps an ominous 1973 analog.
_____________
More from Dana Lyons, JLFMI and My401kPro.
The commentary included in this blog is provided for informational purposes only. It does not constitute a recommendation to invest in any specific investment product or service. Proper due diligence should be performed before investing in any investment vehicle. There is a risk of loss involved in all investments.


