Small-Cap Value Stocks Get The (Elevator) Shaft

The S&P 600 Small-Cap Pure Value Index skipped all stops on its way down to test colossal long-term support.
Next up in our “bull markets take the escalator; bear markets take the elevator” series is the S&P 600 Small-Cap Pure Value Index. This one definitely gets filed under the subset “elevator shaft”. If you’ll recall, we noted in the past few days that following breaks of key support levels on January 6, several indices – including the Value Line Geometric Composite and the Global Dow Index – essentially plunged in a 2-week straight line down to the next major support level. You can add the S&P 600 Small-Cap Pure Value Index to that list.
As the name implies, this “Pure” Value index includes only those S&P 600 stocks exhibiting true “value” characteristics. This is in contrast to the plain S&P 600 Growth and Value Indices which split all 600 stocks into one of the two categories. This Small-Cap Pure Value Index also tends to exhibit the highest volatility, or beta, of any of the style indices. That is, it moves the most, up or down. And it has moved recently, to the downside.
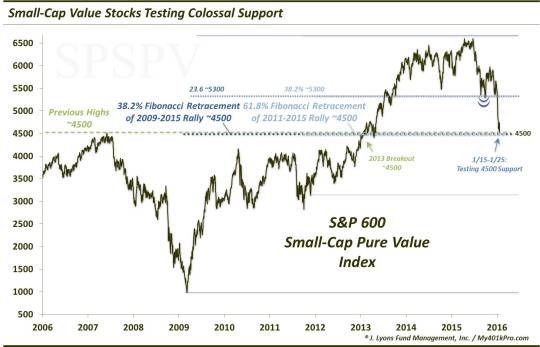
The last time we discussed the index was on October 21 in the midst of the post-September bounce. If you recall, at the end of September low, the index had bounced right at the support level that it “should” have (~5300), by our analysis. This support included:
- The 23.6% Fibonacci Retracement of the 2009-2015 rally
- The 38.2% Fibonacci Retracement of the 2011-2015 rally
- The 61.8% Fibonacci Retracement of the rally from the 2013 breakout level
Its closing low on September 29 was 5292. From there it would bounce some 13% over the next 6 weeks, with most of it coming in the rally’s first week. We noted on one of the charts in the post that, in the event that 5300 was breached, the next major support level was some 15% lower, around 4500. The support indicated there included:
- The 38.2% Fibonacci Retracement of the 2009-2015 rally
- The 61.8% Fibonacci Retracement of the 2011-2015 rally
- The 2013 breakout level
- The former all-time high set in 2006
Well, the 5300 level was taken out and I’ll give you one guess as to the date of that breakdown. Yep, January 6 again. Anyway, the S&P 600 Small-Cap Pure Value Index wasted no time
(i.e., the elevator shaft)
in making its way to the 4500 level. Just 7 days later, on January 15, the Index hit an intraday low of 4500.88. The following day, the index hit a nearly 3-year closing low of 4525.
Over the past week, the index has attempted to bounce, or at least stabilize. Bulls better hope it is successful because we are talking about some magnitudinous support here (yeah, I said it). The prior all-time highs in 2006 and the 2 most important Fibonacci Retracement levels, 61.8% and 38.2%, measured from the 2 most important lows in the history of the index, 2011 and 2009, respectively, represent the most significant potential support that the index will encounter, in our view.
The possibility of a short-term overshoot is certainly something to consider given the velocity of the recent plunge (4250 would equate to the 61.8% Fibonacci Retracement from the October 3, 2011 false breakdown low as well as the 2010-2012 tops). However, if this general level fails to hold in this S&P 600 Small-Cap Pure Value Index, then God help anyone still on this elevator.
_____________
More from Dana Lyons, JLFMI and My401kPro.
The commentary included in this blog is provided for informational purposes only. It does not constitute a recommendation to invest in any specific investment product or service. Proper due diligence should be performed before investing in any investment vehicle. There is a risk of loss involved in all investments.


