Stock Correction Sets Lowly Record

Persistent selling has resulted in an unprecedented stretch of elevated levels of New 52-Week Lows.
One of the most noteworthy aspects to the ongoing stock market correction has been the persistence of selling pressure. Unlike declines in recent years, there has been little to no let up, even when indicators or chart levels suggest the high probability of a bounce. This has left the V-bottomers and dip-buyers bloodied and beaten. One indication of the level of persistent selling can be seen in the current string of elevated daily New 52-Week Lows on the NYSE. In fact, since 1970, it is the single longest such streak of high levels of New Lows.
Specifically, today marked the 8th straight day in which the number of New Lows on the NYSE accounted for at least 15% of all issues traded. There has never been a longer streak. This chart shows all streaks since 1970 lasting at least 5 days.
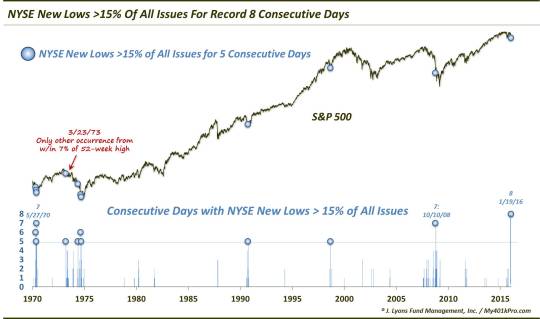
As the chart shows, this makes 11 streaks now of at least 5 days with the NYSE New Lows totaling 15% or more of all issues.
A few of the streaks were clustered together in 1970 and 1974, making the current streak even more rare.
Here are the ending dates of each of these streaks since 1970:
4/29/1970
5/15/1970
5/27/1970
3/23/1973
5/23/1974
8/29/1974
9/16/1974
9/28/1990
9/1/1998
10/10/2008
1/19/2016 (current)
So what is the significance of such persistent broad internal weakness? Well, there is bad news and good news…and finally, potentially some more bad news. The first bit of bad news is self-evident. That is, the current weakness in the stock market is broad-based and persistent.
The good news is that, looking at the previous occurrences, we see that these streaks have tended to occur at or near lows of intermediate-term or cyclical significance. Thus, they have often marked an exhaustion or wash-out type move following a serious market decline.
Looking at the performance of the S&P 500 following such streaks, we see a minor tendency for a snapback rally in the days or week following the readings. More often than not, that has been followed by some more re-testing or choppiness in the intermediate-term, i.e., the subsequent few weeks to 3 months. That is not surprising as selling pressure of this magnitude is not quickly reversed. However, the process of forming a bottom has often been initiated along with the occurrence of these streaks. Thus, you can say that the streaks often marked the beginning of the end of their respective corrections.
The good news is manifested in the longer-term returns. 6 months following the previous 16 days that saw streaks at 5-7 days, the median return in the S&P 500 was +12.4%, with 11 of those days showing a positive return. By 12 months later, the good news was nearly unanimous. 15 of the 16 days showed a positive 1-year forward return, at a median of over +25%. Here are the figures:
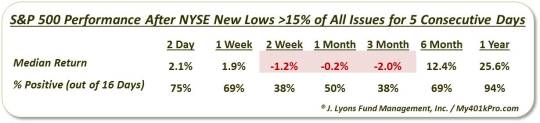
So that’s the good news. If one could put up with a bit of chop over the weeks and months following the streaks, the market’s longer-term prospects brightened considerably. Now for the other bit of potential bad news.
The 1 out of 16 days that did not result in a positive return 1 year later was March 23, 1973. This instance, in fact, occurred closer to the beginning of a lengthy cyclical bear market than near the end of any particular decline. True, the market would chop around for about the next 7 months, but the bear market would not run its course for another 18 months. Thus, you might say this streak marked, at best, the end of the beginning rather than the beginning of the end.
Big deal, you might say. 1 out of 16 does not exactly constitute ominous odds. That’s true, from a quantitative standpoint. However, from a qualitative standpoint, that one occurrence in 1973 probably bears the closest resemblance to our present circumstances. Why?
Most of the streaks occurred following an already substantial degree of selling. The S&P 500 was typically 20%-30% or more off of its 52-week high before the streak even began. The 1973 example, however, began with the S&P 500 less than 5% from its 52-week high. Likewise, the present streak started when the S&P 500 was just a little over 5% from its highs. Therefore, outside of perhaps the short-term, these two instances occurred with the S&P 500 far less oversold or washed-out in the longer-term than any of the others.
Are we cherry-picking this example? Perhaps, but our job as money managers is to determine as best we can the favorability of the investment landscape. This includes (mostly) going by the cold, hard statistics. But it also entails using reason and logic to ascertain when the market is most likely to buck its historical tendencies. Accordingly, in our view, the 1973 example should be given extra weight as a precedent versus the other 15 instances.
Does the 1 outweigh the other 15? We’re not sure, but given our present circumstances, together with the concerns that we have noted over the past year or so related to the sustainability of the bull market, we have to strongly consider the potential negative scenario as much as we do the positive one. Whether that involves a 50% drawdown as per the 1973 scenario, we don’t know. However, in this instance, we would caution against blindly adopting the expectations for a 25% rally over the next 12 months.
Regardless of the longer-term outlook, this streak of extreme “lowliness” should mark some sort of exhaustion in selling pressure. Even in 2008, stocks bounced, albeit temporarily. Thus, some short to intermediate-term reprieve should soon arrive. The question will be whether the reprieve marks the beginning of the end of the decline – or just the end of the beginning.
________
More from Dana Lyons, JLFMI and My401kPro.
The commentary included in this blog is provided for informational purposes only. It does not constitute a recommendation to invest in any specific investment product or service. Proper due diligence should be performed before investing in any investment vehicle. There is a risk of loss involved in all investments.


