What’s Next For Stocks After Record New Year Week 1 Hangover?
U.S. stocks logged the worst week ever to kick off a new year; is this historically low reading on the “January Barometer” a bad omen going forward?
Last Monday, we posted a piece regarding what was one of the worst year-opening days ever for stocks. In it, we looked at prior years that saw very weak days to open the year to see what it might mean (if anything) going forward. Well, it must have been some New Year’s Eve party because the hangover persisted for the entire week. In fact, it was the worst opening week to a year for stocks in U.S. market history.
That distinction is based on the loss in the Dow Jones Industrial Average (DJIA) of -6.19% last week, the worst since 1900.
Some market observers would argue that this performance portends bad things for the stock market over the rest of the year, according to the “January Barometer” indicator based on the 1st 5 days of the year.
As with last Monday’s post, we took a look at previous poor weeks to open a new year to see if they led to any consistent behavior in the stock market going forward. Specifically, we looked at all 1st week losses of at least 2% in the DJIA since 1925. As it turns out, there were 9 prior such cases:
1934 -2.96%
1939 -2.08%
1955 -2.17%
1962 -3.03%
1969 -2.38%
1977 -2.14%
1978 -5.61%
1991 -4.72%
2008 -5.09%
2016 -6.18%
The DJIA’s performance following these poor first weeks was a mixed bag, although there was more bad than good. This chart shows the performance through year-end of each of the years following the first week.
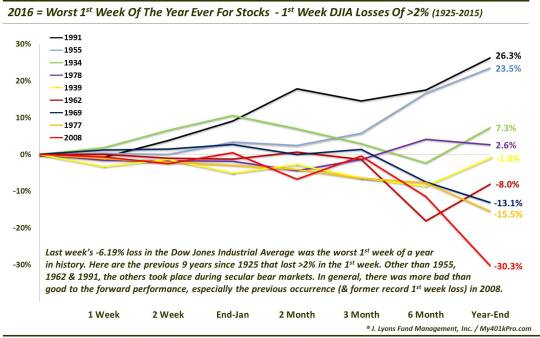
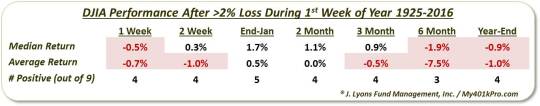
As the chart illustrates, there were a few occurrences when the DJIA went on to have a very good year, 1991 and 1955, in particular. There were also some bad years, especially 2008 which happened to be the previous record-holder for the worst opening week to a year, at -5.09%. It would close the year down another -30.3% from that opening week. Along the way, average and median returns were muted, with a few more negative periods than positive overall. As it happens, the best-performing period following the weak 1st weeks was the period through the end of January, as the following table shows.
With a sample size of just 9 years, it is difficult to have much confidence in any predictive patterns here, especially as there was a fair amount of variance. The only thing we can say is that, for the majority of years, returns were lackluster at best. So, at the very least, we cannot say there was a strong tendency for the market to snap back strongly, even if it is still a reach to call this a bad omen for the rest of 2016.
One interesting note is that 6 of the prior 9 examples occurred during secular (i.e., long-term) bear markets. It is our view that U.S. stocks remain in the post-2000 secular bear, despite the past 3 years’ performance of the S&P 500. Therefore, the start to this year would not be totally out of character if we are correct, though the extent of the losses obviously are unprecedented.
So is there any real takeaway here? Probably nothing that is actionable, no. Perhaps it would not surprise to get a bit of a bounce back during this month before a lackluster performance over the remainder of the year. That is mere speculation, though. If you want to worry about something in this market, we have provided plenty of material for that over the last several month, or years. This New Year’s hangover, however, would be at the bottom of that list.
________
New Year’s hangover photo from Houston.culture map.com.
More from Dana Lyons, JLFMI and My401kPro.
The commentary included in this blog is provided for informational purposes only. It does not constitute a recommendation to invest in any specific investment product or service. Proper due diligence should be performed before investing in any investment vehicle. There is a risk of loss involved in all investments.


