Another Relative Strength Staple Scores An All-Time High

RHS, an equal-weight consumer staples ETF, continues its recent show of relative strength by hitting a new all-time high.
After a year like 2015 that was loaded with hollow, unconfirmed new highs in the stock market, followed up by the beginning of 2016 that saw the worst start in stock market history, finding intriguing “Chart Of The Day” candidates can seem like an arduous task. Let’s face it, as chartists, we were spoiled last year with an abundance of “potential all-time bad” and in January with “realized all-time bad”. Thus, after a bounce off the lows and into middle ground, things can appear a bit mundane these days. That’s when we go back to the basics.
Whether it’s good, old-school chart analysis like yesterday’s post on the Value Line Composite or highlighting a fund displaying attractive current relative strength, like Monday’s post on a dividend ETF, these “back to the basics” charts aren’t as flashy as some charts over the past 12 months. Nonetheless, they are every bit as practical and useful as any. And that, ultimately, is the objective behind our sharing of content. If the stuff we posted had no relevance or utility in making investment decisions, we wouldn’t bother doing this (not to mention, you most likely would not be reading any of it anyway.)
Today’s Chart Of The Day is just another good example of the virtues of the relative strength investment selection approach that we espouse. Once again, by relative strength, we are simply referring to a philosophy whereby we try to concentrate our investments in the areas of the market that are performing well. That may sound obvious, but it actually runs contrary to the way that a lot of investment dollars are managed, e.g., mean-reversion, value plays, catching falling knives, etc. Of course, designing a system to identify and profit from relative strength before the strength fades is the million-dollar challenge.
We do have a proprietary relative strength investment selection model that we employ which works for us over an intermediate-term time frame (i.e., at least several months). Others may certainly have a different time frame and certainly different inputs – to each their own. However, our system works for us. And one of the funds the model has had on its radar for well over a year now is the Rydex S&P Equal-Weight Consumer Staples ETF (ticker RHS). And the fund is still squarely on the radar as it struck a new all-time high today.
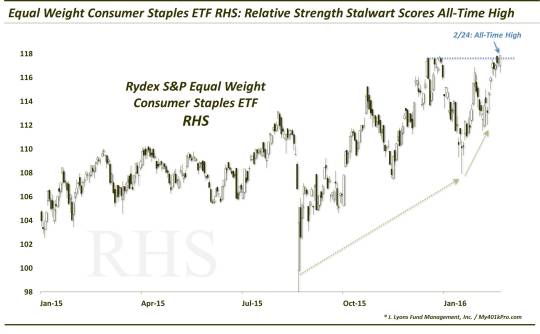
In Monday’s post on the ETF, FDL, we wrote that relative strength can be demonstrated in both good markets (by gaining more) as well as bad markets (by losing less). RHS has been able to fulfill both duties as it has continued to consistently score new highs over the past few years and has been more resilient than most funds during the corrections of the past 6 months.
For example, like FDL, RHS held well above its August lows while the market tested its in January. Likewise, in mid-February, while the January lows were being tested across most areas of the market, RHS was able to stay well above its January low. That’s what you want to see from potential future relative strength candidates when emerging from a low. Those areas of the market that return to their former highs first following a selloff are often leaders in the subsequent rally.
Speaking of subsequent rally, will we get a durable one here? We covered those prospects in yesterday’s post concluding that, while there were technical challenges on the charts nearby, there was also compelling evidence to expect a further rally. We do not know what will transpire here, but we will say that as long as something is still displaying positive relative strength, it is a good omen for the immediate-term stock market prospects. It is really only during the teeth of a bear market – when there is no place to hide, everything is getting smashed and correlations go to 1.0 – that relative strength loses any and all utility.
The fact that there are investment options like RHS that continue to head to new highs suggests that we are not yet at the gate of that “nowhere-to-hide” phase of a bear market.
________
More from Dana Lyons, JLFMI and My401kPro.
The commentary included in this blog is provided for informational purposes only. It does not constitute a recommendation to invest in any specific investment product or service. Proper due diligence should be performed before investing in any investment vehicle. There is a risk of loss involved in all investments.


