Bearish Fund Flows Hit 4-Year High AFTER Big Rally…Again

Assets in bearish Rydex mutual funds have spiked to their highest level since 2011 – AFTER another 100-point S&P 500 rally.
One common misstep on the part of investors is that they are constantly fighting yesterday’s battles. Spurred by perceptual recency, investors tend to chase, or flee from, market sectors or issues whose time has past. A longer-term example of this phenomenon was investors’ continued obsession with internet and high tech stocks throughout much of the 2000’s, even though they were dead money following the 2000 bubble top. From a shorter-term perspective, it is not uncommon to see investors seek protection through hedges – after they’ve already incurred big losses. We presently see an example of this (potentially) via the level of assets in inverse, or bearish, mutual funds.
Specifically, the Guggenheim (formerly Rydex) family of funds offers a stable of these bearish funds and publishes daily the level of assets invested in each. A peek at the current combined assets in these funds yields a somewhat surprising discovery. As of yesterday, February 17, the combined assets in the group of Rydex bear funds that we track reached over $500 million for the first time in more than 4 years. The peculiar thing about this development is that much of the increase came after a 3-day, 100-point (~6%) rally in the S&P 500 off of its 52-week low. These investors appear to be battling the losses they incurred over the prior weeks and months.
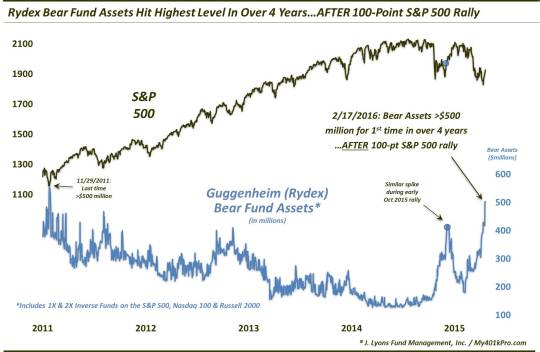
(in this case, the Rydex bearish funds consist of the 1X and 2X inverse funds on the S&P 500, Nasdaq 100 and Russell 2000).
How extreme are current readings? Consider the following:
- Rydex bearish assets are ~20% higher than they were at the February 11 52-week low in the S&P 500.
- The last time Rydex bear fund assets were as high as today was November 29, 2011 (the market has not been that low since).
- Assets in the 1X and 2X inverse Russell 2000 funds are the highest since September 17, 2007.
- The combined assets in the 1X and 2X inverse S&P 500 funds are the highest since September 18, 2013 (not a bad short-term short then, btw).
-
Combined assets in the 1X and 2X inverse Nasdaq 100 funds are the highest since October 7, 2015 and have more than doubled over the past 10 days.
This is indeed peculiar since sentiment gauges, such as money flows, tend to move in the direction of the market. That is, sentiment generally becomes more bullish as the market rallies and more bearish as the market declines. And when the gauges reach an extreme, contrarian investors like to “fade” the crowd, or go in the opposite direction. Typically, that is a profitable strategy – provided one is accurately able to identify what constitutes an “extreme”.
And perhaps the only thing that makes a contrarian’s eyes light up more than an extreme in investor sentiment is an extreme that occurs counter-intuitively to the market direction. For example, these Rydex investors appear to be trying to out-smart the market by shorting into market strength, an unusual tactic based on their typical behavioral patterns. And historically, this tactic does not generally work out well for most groups of investors.
In fact, we saw almost the same exact scenario during the early October rally last year, following the re-test of the August market lows. In an October 6 post, we detailed how Rydex bear funds had spiked to a 3-year high despite a similar 100-point rally over the prior few days in the S&P 500. Our conclusion at the time was that the atypical jump in bearish assets during the market rally was indicative of investors fighting a battle that was already over – and was likely a “cut-and-dry” bullish sign. And so it was as the S&P 500 continued to rally, tacking on another 6% over the next month before stalling.
Obviously the bears are hoping for one more shoe to drop in the correction before a potential, more durable, intermediate-term bottom is in place. The one possible thing that they have going for them is this fact:
- Besides today and early October of last year, the only other days since 2007 that Rydex bear assets hit a 12-month high while the S&P 500 was at least 5.6% off of its 1-month low were September 14-16, 2011 and September 16 of last year. Those 2 periods did lead to a sharp drop in stocks before a final bottom. However…those dates came prior to a re-test of the preceding initial lows. In this case, like last October, stocks have already tested the lows forged in late January.
So will there be one more shoe to drop – or did these “silly, ol’ bears” get their head stuck in the honey pot again? All things considered, we have to come to the same conclusion now that we did in October. While the market may not jump another 6% higher unabated like it did last October, extremes in investment posture on the part of investors, collectively, rarely pay off for the collective. It is particularly true when the extremes are built up in a counter-intuitive fashion. Thus, we have to vote for the honey pot before the shoe.
_______
More from Dana Lyons, JLFMI and My401kPro.
The commentary included in this blog is provided for informational purposes only. It does not constitute a recommendation to invest in any specific investment product or service. Proper due diligence should be performed before investing in any investment vehicle. There is a risk of loss involved in all investments.


