Broad Market Index Testing Broken “Must Hold” Level

The broad NYSE Composite stock market index is testing the level
we deemed
“must hold” – that broke in January.
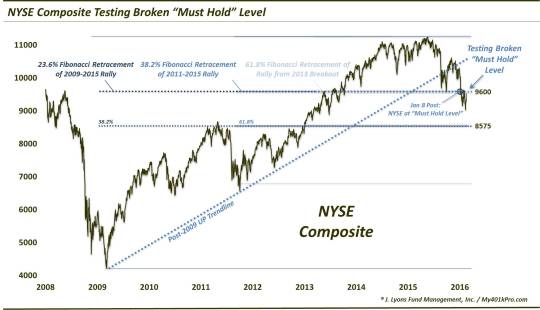
Back on January 8, we posted a chart illustrating that the broad NYSE Composite was at a “must hold” level, in our view. Signifying the confluence of 3 major post-2009 bull market Fibonacci Retracement lines, we considered the area around 9600 to be critical for the NYSE to hold. Specifically, these lines lay in the vicinity:
- The 23.6% Fibonacci Retracement of the 2009-2015 rally
- The 38.2% Fibonacci Retracement of the 2011-2015 rally, and
- The 61.8% Fibonacci Retracement of the rally from the early 2013 breakout level to the 2015 high
And while our analysis identified significant potential support, there were 2 things that suggested to us that, sooner or later, that “must hold” level would fail to hold. First, the NYSE had tested that level already in August and September, holding successfully. That event had likely “softened” up the potential support at the 9600 level.
Secondly, earlier in the week,
on January 6, we witnessed what we considered to be a key day in the market as a number of major indices suffered consequential breakdowns (Jan 6: “BREAKING!: The Bull Market?”). The levels broken by those indices were similar in nature to the one being tested by the NYSE. Thus, we concluded “we would not be surprised to see the level hold again, temporarily…before eventually failing as other indices are doing.” Well, the NYSE’s attempt to hold lasted a whole 3 days before the 9600 area broke.
We identified the next major potential downside support level to be around 8575, which was another 10% of risk below there. The NYSE got as low as 8938 – in about 3 days –, a drop of nearly 7%, before bouncing on January 20. In late January, the NYSE rallied back up to test the “must hold” 9600 level, failing in its attempt. After testing the January low again last week, the index is back to test the 9600 level again.
The reaction of this broad market index at this level could be key for the stock market as a whole. In our view, the market is likely in the early stages of a cyclical bear market. However, in the intermediate-term, should the NYSE (and similar indices) find success in overcoming their respective “must hold” levels which they broke in early January, it could buy them some time, and upside, in the immediate-term.
If the NYSE successfully reclaims the 9600 area, we could see another possible 7% of upside in the index over the intermediate-term prior to a potential new leg down. Of course, if the index fails here, that 8575 area remains at risk. This will be a development that we’ll be monitoring closely for tactical investment guidance in the near-term.
________
Polar Bear looking through “glassy” water photo by Paul Souders, winner of the 2013 National Geographic Photo Contest.
More from Dana Lyons, JLFMI and My401kPro.
The commentary included in this blog is provided for informational purposes only. It does not constitute a recommendation to invest in any specific investment product or service. Proper due diligence should be performed before investing in any investment vehicle. There is a risk of loss involved in all investments.


